Zip Codes with the Highest Percentage of Population Employed in Health Diagnosing & Treating in Denham Springs, LA
RELATED REPORTS & OPTIONS
Health Diagnosing & Treating
Denham Springs
Compare Zip Codes
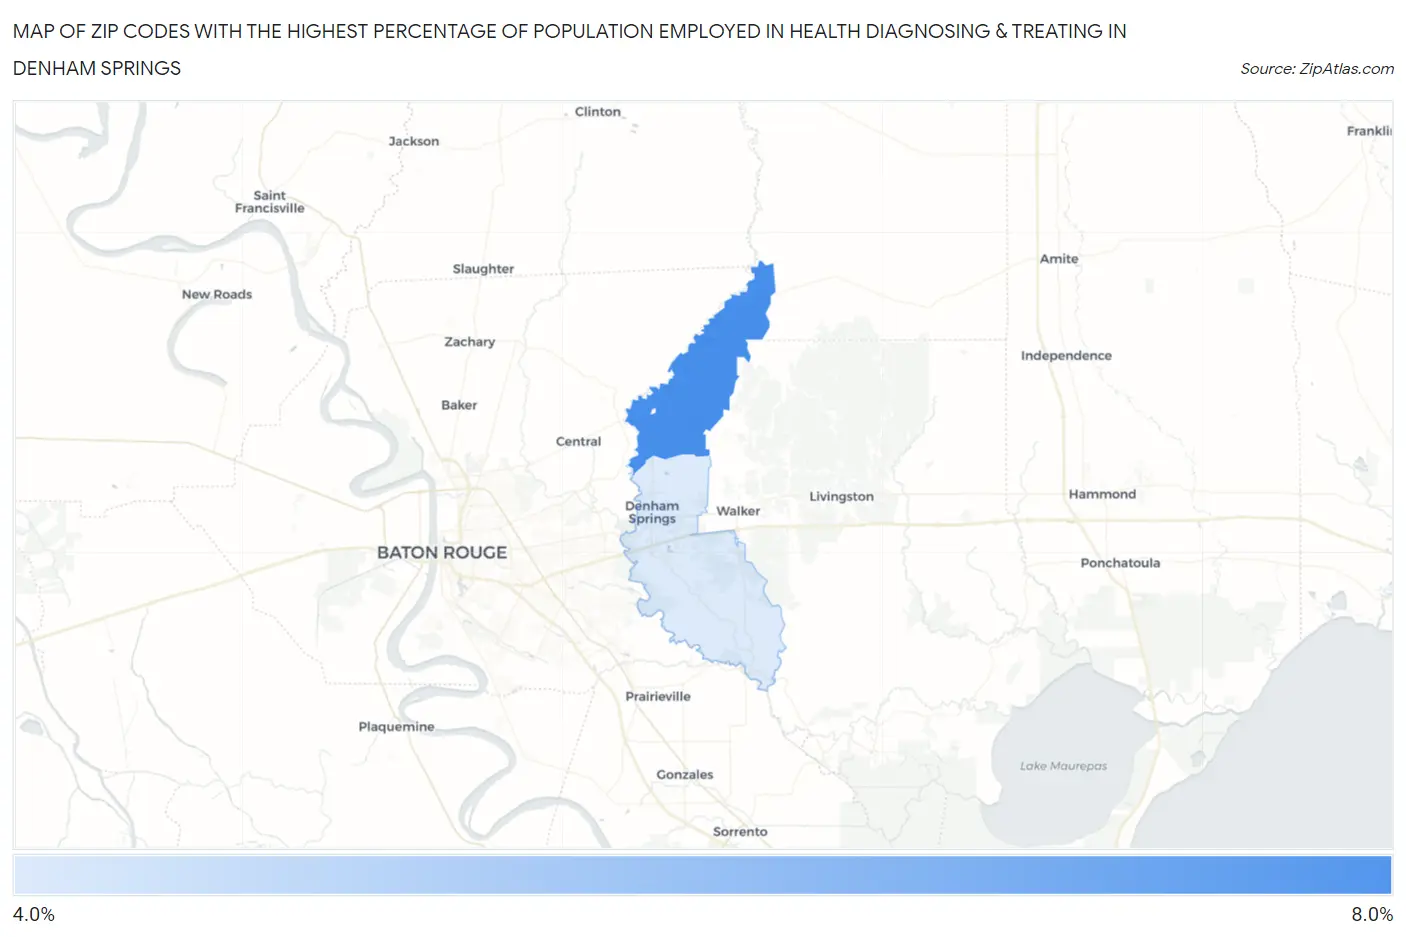
Map of Zip Codes with the Highest Percentage of Population Employed in Health Diagnosing & Treating in Denham Springs
4.5%
6.3%
Zip Codes with the Highest Percentage of Population Employed in Health Diagnosing & Treating in Denham Springs, LA
| Zip Code | % Employed | vs State | vs National | |
| 1. | 70706 | 6.3% | 7.2%(-0.889)#237 | 6.2%(+0.033)#12,849 |
| 2. | 70726 | 4.5% | 7.2%(-2.68)#335 | 6.2%(-1.76)#19,703 |
1
Common Questions
What are the Top Zip Codes with the Highest Percentage of Population Employed in Health Diagnosing & Treating in Denham Springs, LA?
Top Zip Codes with the Highest Percentage of Population Employed in Health Diagnosing & Treating in Denham Springs, LA are:
What zip code has the Highest Percentage of Population Employed in Health Diagnosing & Treating in Denham Springs, LA?
70706 has the Highest Percentage of Population Employed in Health Diagnosing & Treating in Denham Springs, LA with 6.3%.
What is the Percentage of Population Employed in Health Diagnosing & Treating in Denham Springs, LA?
Percentage of Population Employed in Health Diagnosing & Treating in Denham Springs is 4.0%.
What is the Percentage of Population Employed in Health Diagnosing & Treating in Louisiana?
Percentage of Population Employed in Health Diagnosing & Treating in Louisiana is 7.2%.
What is the Percentage of Population Employed in Health Diagnosing & Treating in the United States?
Percentage of Population Employed in Health Diagnosing & Treating in the United States is 6.2%.