Zip Codes with the Highest Percentage of Population with a Degree in Visual and Performing Arts in Denham Springs, LA
RELATED REPORTS & OPTIONS
Visual and Performing Arts
Denham Springs
Compare Zip Codes
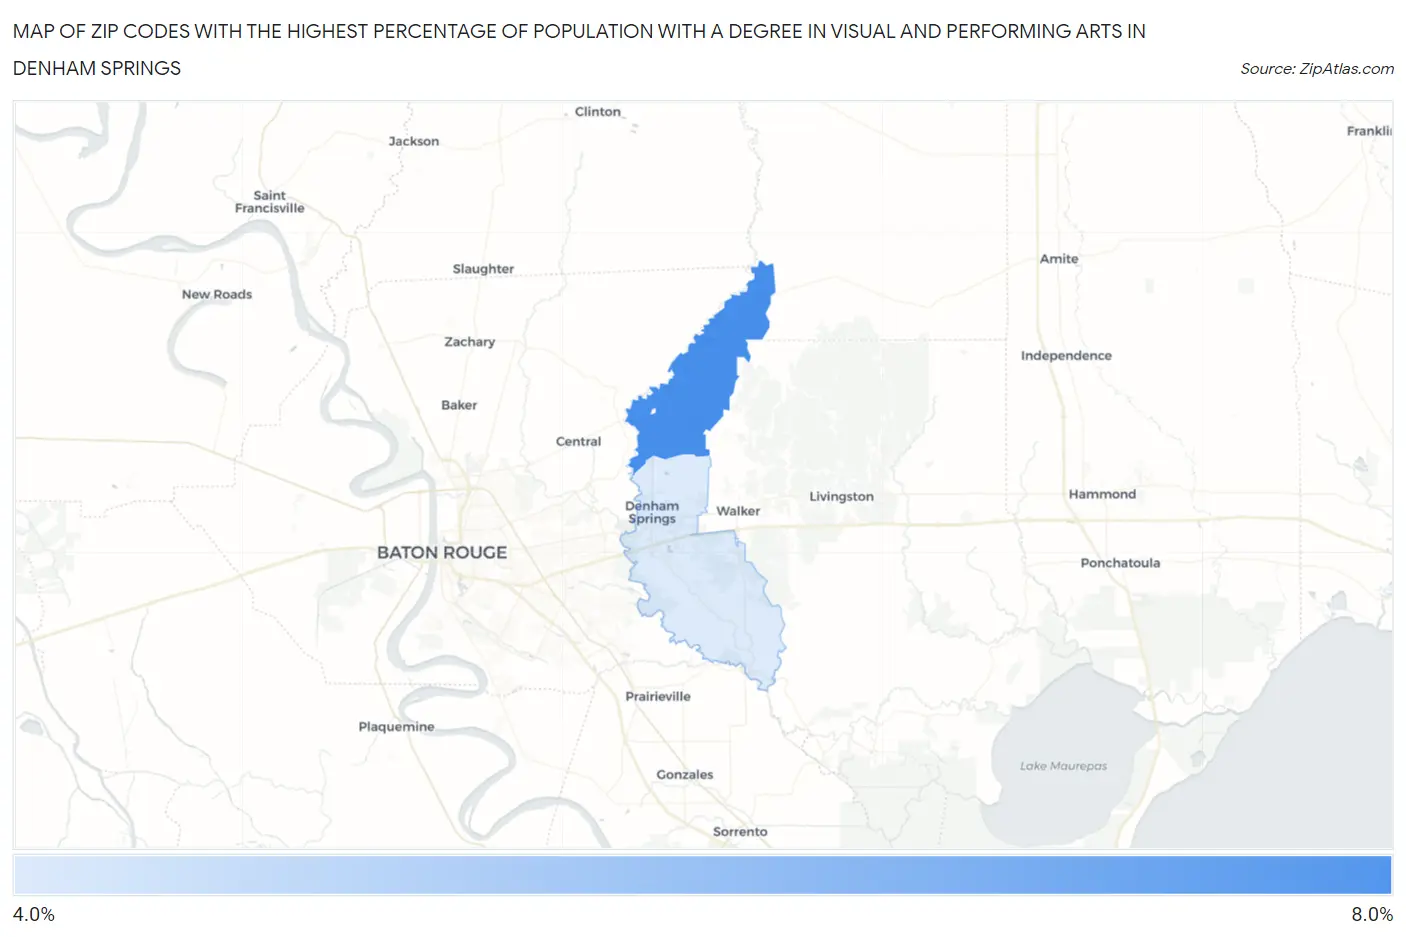
Map of Zip Codes with the Highest Percentage of Population with a Degree in Visual and Performing Arts in Denham Springs
4.3%
7.2%
Zip Codes with the Highest Percentage of Population with a Degree in Visual and Performing Arts in Denham Springs, LA
| Zip Code | % Graduates | vs State | vs National | |
| 1. | 70706 | 7.2% | 3.3%(+3.95)#26 | 4.3%(+2.98)#3,443 |
| 2. | 70726 | 4.3% | 3.3%(+1.06)#62 | 4.3%(+0.093)#8,230 |
1
Common Questions
What are the Top Zip Codes with the Highest Percentage of Population with a Degree in Visual and Performing Arts in Denham Springs, LA?
Top Zip Codes with the Highest Percentage of Population with a Degree in Visual and Performing Arts in Denham Springs, LA are:
What zip code has the Highest Percentage of Population with a Degree in Visual and Performing Arts in Denham Springs, LA?
70706 has the Highest Percentage of Population with a Degree in Visual and Performing Arts in Denham Springs, LA with 7.2%.
What is the Percentage of Population with a Degree in Visual and Performing Arts in Denham Springs, LA?
Percentage of Population with a Degree in Visual and Performing Arts in Denham Springs is 16.3%.
What is the Percentage of Population with a Degree in Visual and Performing Arts in Louisiana?
Percentage of Population with a Degree in Visual and Performing Arts in Louisiana is 3.3%.
What is the Percentage of Population with a Degree in Visual and Performing Arts in the United States?
Percentage of Population with a Degree in Visual and Performing Arts in the United States is 4.3%.