Zip Codes with the Highest Percentage of Households Heated by Bottled Gas / Liquid Propane in Denham Springs, LA
RELATED REPORTS & OPTIONS
Bottled Gas / LP Heating
Denham Springs
Compare Zip Codes
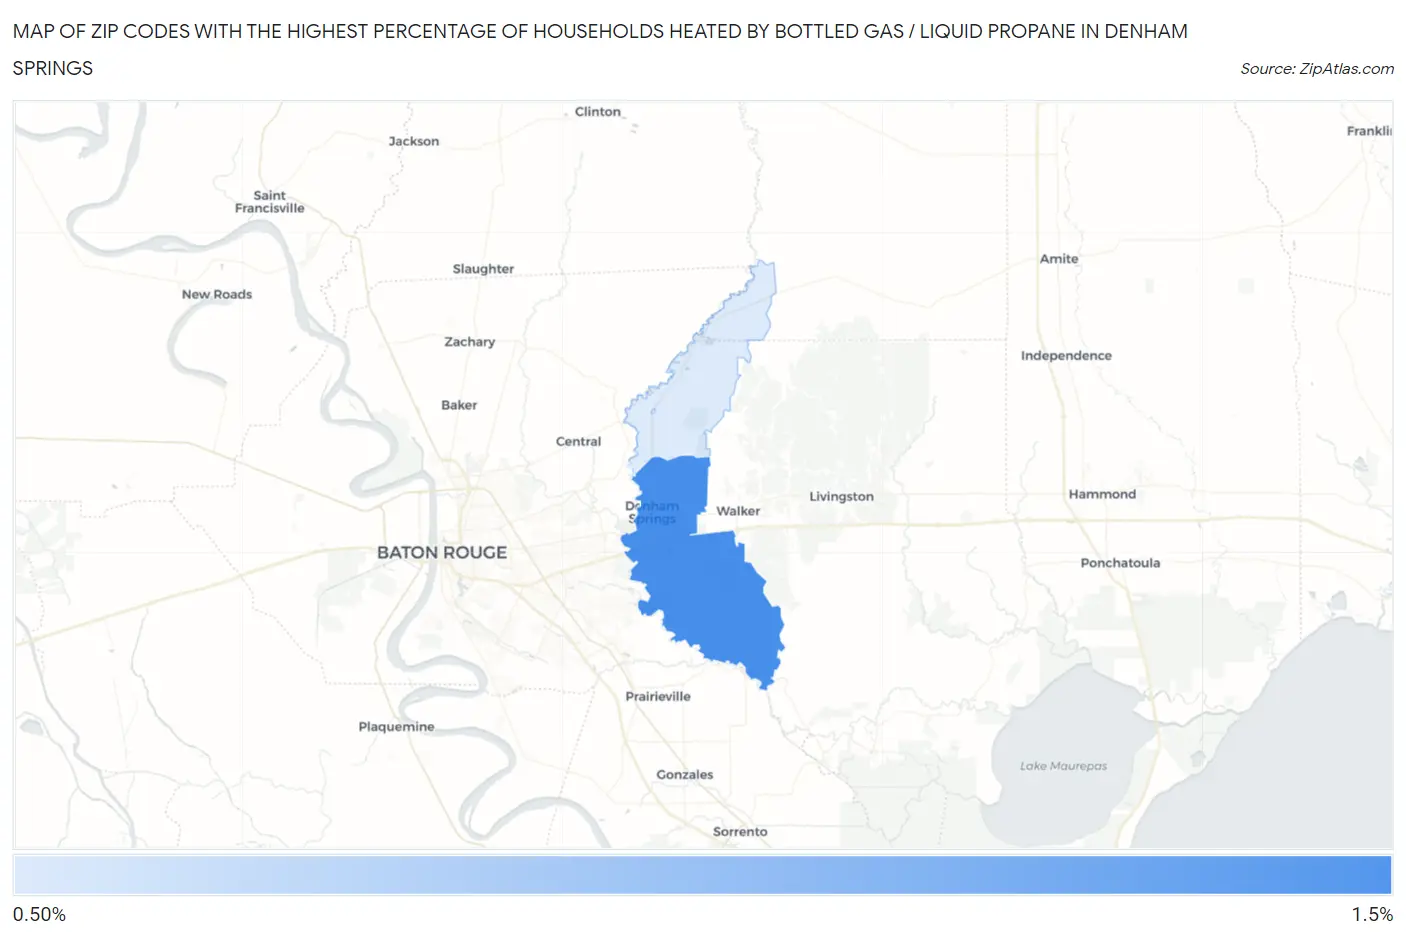
Map of Zip Codes with the Highest Percentage of Households Heated by Bottled Gas / Liquid Propane in Denham Springs
0.80%
1.2%
Zip Codes with the Highest Percentage of Households Heated by Bottled Gas / Liquid Propane in Denham Springs, LA
| Zip Code | Bottled Gas / LP Heating | vs State | vs National | |
| 1. | 70726 | 1.2% | 1.9%(-0.700)#255 | 4.9%(-3.70)#25,731 |
| 2. | 70706 | 0.80% | 1.9%(-1.10)#301 | 4.9%(-4.10)#27,554 |
1
Common Questions
What are the Top Zip Codes with the Highest Percentage of Households Heated by Bottled Gas / Liquid Propane in Denham Springs, LA?
Top Zip Codes with the Highest Percentage of Households Heated by Bottled Gas / Liquid Propane in Denham Springs, LA are:
What zip code has the Highest Percentage of Households Heated by Bottled Gas / Liquid Propane in Denham Springs, LA?
70726 has the Highest Percentage of Households Heated by Bottled Gas / Liquid Propane in Denham Springs, LA with 1.2%.
What is the Percentage of Households Heated by Bottled Gas / Liquid Propane in Denham Springs, LA?
Percentage of Households Heated by Bottled Gas / Liquid Propane in Denham Springs is 0.50%.
What is the Percentage of Households Heated by Bottled Gas / Liquid Propane in Louisiana?
Percentage of Households Heated by Bottled Gas / Liquid Propane in Louisiana is 1.9%.
What is the Percentage of Households Heated by Bottled Gas / Liquid Propane in the United States?
Percentage of Households Heated by Bottled Gas / Liquid Propane in the United States is 4.9%.