Mexican American Indian vs Cheyenne Wage/Income Gap
COMPARE
Mexican American Indian
Cheyenne
Wage/Income Gap
Wage/Income Gap Comparison
Mexican American Indians
Cheyenne
24.7%
WAGE/INCOME GAP
92.2/ 100
METRIC RATING
134th/ 347
METRIC RANK
23.3%
WAGE/INCOME GAP
99.7/ 100
METRIC RATING
86th/ 347
METRIC RANK
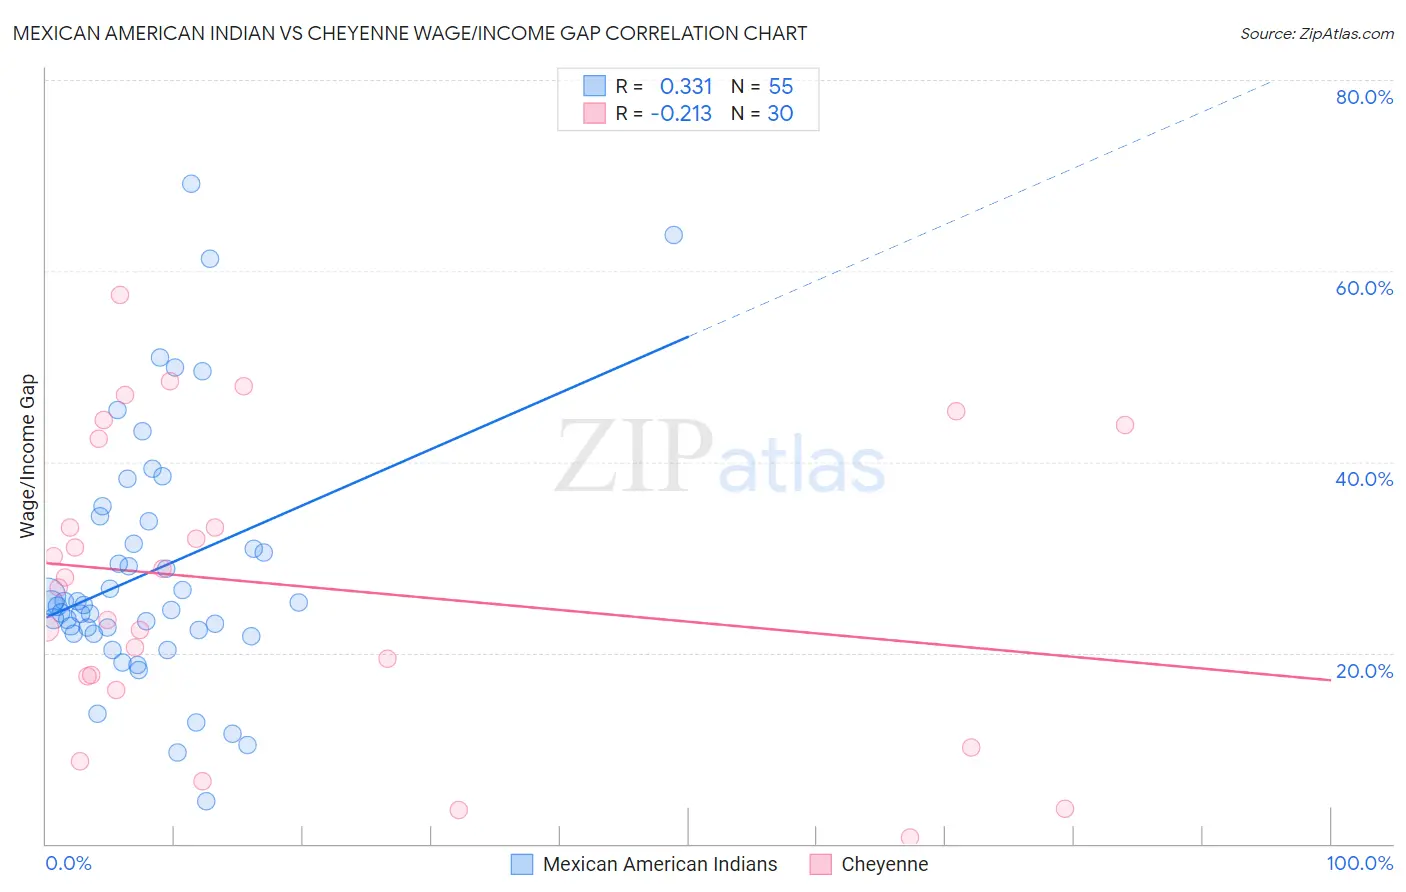
Mexican American Indian vs Cheyenne Wage/Income Gap Correlation Chart
The statistical analysis conducted on geographies consisting of 317,413,111 people shows a mild positive correlation between the proportion of Mexican American Indians and wage/income gap percentage in the United States with a correlation coefficient (R) of 0.331 and weighted average of 24.7%. Similarly, the statistical analysis conducted on geographies consisting of 80,669,985 people shows a weak negative correlation between the proportion of Cheyenne and wage/income gap percentage in the United States with a correlation coefficient (R) of -0.213 and weighted average of 23.3%, a difference of 6.0%.
Wage/Income Gap Correlation Summary
| Measurement | Mexican American Indian | Cheyenne |
| Minimum | 4.5% | 0.62% |
| Maximum | 69.1% | 57.5% |
| Range | 64.7% | 56.8% |
| Mean | 28.5% | 27.1% |
| Median | 25.0% | 27.3% |
| Interquartile 25% (IQ1) | 22.0% | 17.6% |
| Interquartile 75% (IQ3) | 33.7% | 42.4% |
| Interquartile Range (IQR) | 11.7% | 24.8% |
| Standard Deviation (Sample) | 13.1% | 15.3% |
| Standard Deviation (Population) | 13.0% | 15.0% |
Similar Demographics by Wage/Income Gap
Demographics Similar to Mexican American Indians by Wage/Income Gap
In terms of wage/income gap, the demographic groups most similar to Mexican American Indians are Colombian (24.7%, a difference of 0.030%), Immigrants from Costa Rica (24.7%, a difference of 0.040%), South American Indian (24.7%, a difference of 0.060%), Immigrants from Philippines (24.7%, a difference of 0.19%), and Armenian (24.8%, a difference of 0.20%).
| Demographics | Rating | Rank | Wage/Income Gap |
| German Russians | 93.7 /100 | #127 | Exceptional 24.6% |
| Immigrants | Central America | 93.5 /100 | #128 | Exceptional 24.6% |
| Yup'ik | 93.3 /100 | #129 | Exceptional 24.7% |
| Alsatians | 93.2 /100 | #130 | Exceptional 24.7% |
| Immigrants | Philippines | 93.0 /100 | #131 | Exceptional 24.7% |
| Immigrants | Costa Rica | 92.4 /100 | #132 | Exceptional 24.7% |
| Colombians | 92.4 /100 | #133 | Exceptional 24.7% |
| Mexican American Indians | 92.2 /100 | #134 | Exceptional 24.7% |
| South American Indians | 92.0 /100 | #135 | Exceptional 24.7% |
| Armenians | 91.3 /100 | #136 | Exceptional 24.8% |
| Immigrants | South Eastern Asia | 90.9 /100 | #137 | Exceptional 24.8% |
| Immigrants | Bosnia and Herzegovina | 90.1 /100 | #138 | Exceptional 24.8% |
| Hispanics or Latinos | 89.5 /100 | #139 | Excellent 24.9% |
| Immigrants | Nepal | 89.3 /100 | #140 | Excellent 24.9% |
| Hawaiians | 89.3 /100 | #141 | Excellent 24.9% |
Demographics Similar to Cheyenne by Wage/Income Gap
In terms of wage/income gap, the demographic groups most similar to Cheyenne are Yuman (23.3%, a difference of 0.050%), Immigrants from Cambodia (23.3%, a difference of 0.20%), Cuban (23.3%, a difference of 0.26%), Immigrants from Panama (23.4%, a difference of 0.37%), and Marshallese (23.4%, a difference of 0.46%).
| Demographics | Rating | Rank | Wage/Income Gap |
| Immigrants | Nicaragua | 99.9 /100 | #79 | Exceptional 23.0% |
| Salvadorans | 99.9 /100 | #80 | Exceptional 23.0% |
| Bermudans | 99.8 /100 | #81 | Exceptional 23.1% |
| Central Americans | 99.8 /100 | #82 | Exceptional 23.1% |
| Immigrants | Africa | 99.8 /100 | #83 | Exceptional 23.2% |
| Cubans | 99.7 /100 | #84 | Exceptional 23.3% |
| Immigrants | Cambodia | 99.7 /100 | #85 | Exceptional 23.3% |
| Cheyenne | 99.7 /100 | #86 | Exceptional 23.3% |
| Yuman | 99.7 /100 | #87 | Exceptional 23.3% |
| Immigrants | Panama | 99.6 /100 | #88 | Exceptional 23.4% |
| Marshallese | 99.6 /100 | #89 | Exceptional 23.4% |
| Nicaraguans | 99.6 /100 | #90 | Exceptional 23.4% |
| Arapaho | 99.6 /100 | #91 | Exceptional 23.5% |
| Immigrants | Honduras | 99.5 /100 | #92 | Exceptional 23.5% |
| Immigrants | Cabo Verde | 99.5 /100 | #93 | Exceptional 23.6% |