Iroquois vs Cheyenne Householder Income Ages 25 - 44 years
COMPARE
Iroquois
Cheyenne
Householder Income Ages 25 - 44 years
Householder Income Ages 25 - 44 years Comparison
Iroquois
Cheyenne
$83,682
HOUSEHOLDER INCOME AGES 25 - 44 YEARS
0.2/ 100
METRIC RATING
273rd/ 347
METRIC RANK
$79,152
HOUSEHOLDER INCOME AGES 25 - 44 YEARS
0.0/ 100
METRIC RATING
314th/ 347
METRIC RANK
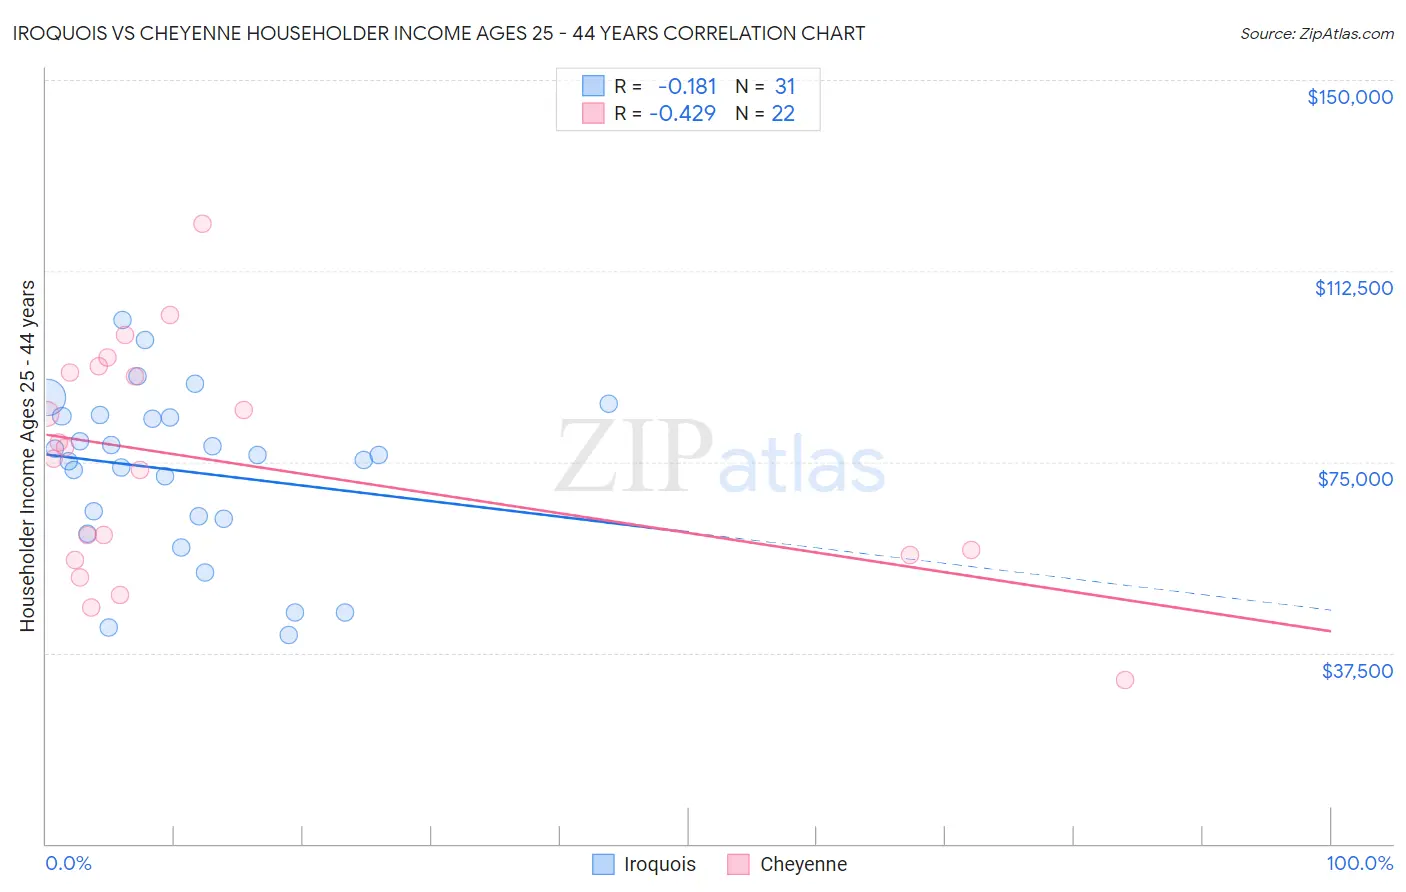
Iroquois vs Cheyenne Householder Income Ages 25 - 44 years Correlation Chart
The statistical analysis conducted on geographies consisting of 207,014,213 people shows a poor negative correlation between the proportion of Iroquois and household income with householder between the ages 25 and 44 in the United States with a correlation coefficient (R) of -0.181 and weighted average of $83,682. Similarly, the statistical analysis conducted on geographies consisting of 80,627,434 people shows a moderate negative correlation between the proportion of Cheyenne and household income with householder between the ages 25 and 44 in the United States with a correlation coefficient (R) of -0.429 and weighted average of $79,152, a difference of 5.7%.
Householder Income Ages 25 - 44 years Correlation Summary
| Measurement | Iroquois | Cheyenne |
| Minimum | $40,878 | $32,083 |
| Maximum | $102,951 | $121,699 |
| Range | $62,073 | $89,616 |
| Mean | $73,208 | $74,807 |
| Median | $76,438 | $76,769 |
| Interquartile 25% (IQ1) | $63,949 | $56,719 |
| Interquartile 75% (IQ3) | $84,029 | $92,585 |
| Interquartile Range (IQR) | $20,079 | $35,866 |
| Standard Deviation (Sample) | $16,006 | $22,346 |
| Standard Deviation (Population) | $15,746 | $21,832 |
Similar Demographics by Householder Income Ages 25 - 44 years
Demographics Similar to Iroquois by Householder Income Ages 25 - 44 years
In terms of householder income ages 25 - 44 years, the demographic groups most similar to Iroquois are Spanish American ($83,722, a difference of 0.050%), Somali ($83,752, a difference of 0.080%), Marshallese ($83,575, a difference of 0.13%), Jamaican ($83,933, a difference of 0.30%), and Immigrants from Jamaica ($83,298, a difference of 0.46%).
| Demographics | Rating | Rank | Householder Income Ages 25 - 44 years |
| Immigrants | Cabo Verde | 0.3 /100 | #266 | Tragic $84,304 |
| Hmong | 0.3 /100 | #267 | Tragic $84,258 |
| Sub-Saharan Africans | 0.3 /100 | #268 | Tragic $84,235 |
| Spanish American Indians | 0.3 /100 | #269 | Tragic $84,085 |
| Jamaicans | 0.3 /100 | #270 | Tragic $83,933 |
| Somalis | 0.2 /100 | #271 | Tragic $83,752 |
| Spanish Americans | 0.2 /100 | #272 | Tragic $83,722 |
| Iroquois | 0.2 /100 | #273 | Tragic $83,682 |
| Marshallese | 0.2 /100 | #274 | Tragic $83,575 |
| Immigrants | Jamaica | 0.2 /100 | #275 | Tragic $83,298 |
| Immigrants | Belize | 0.2 /100 | #276 | Tragic $83,141 |
| Paiute | 0.2 /100 | #277 | Tragic $82,984 |
| Senegalese | 0.2 /100 | #278 | Tragic $82,852 |
| Pima | 0.1 /100 | #279 | Tragic $82,821 |
| Colville | 0.1 /100 | #280 | Tragic $82,604 |
Demographics Similar to Cheyenne by Householder Income Ages 25 - 44 years
In terms of householder income ages 25 - 44 years, the demographic groups most similar to Cheyenne are Ottawa ($79,012, a difference of 0.18%), African ($78,986, a difference of 0.21%), Menominee ($79,358, a difference of 0.26%), Immigrants from Haiti ($79,391, a difference of 0.30%), and U.S. Virgin Islander ($78,911, a difference of 0.30%).
| Demographics | Rating | Rank | Householder Income Ages 25 - 44 years |
| Haitians | 0.0 /100 | #307 | Tragic $80,055 |
| Immigrants | Central America | 0.0 /100 | #308 | Tragic $80,012 |
| Chippewa | 0.0 /100 | #309 | Tragic $80,005 |
| Fijians | 0.0 /100 | #310 | Tragic $79,956 |
| Indonesians | 0.0 /100 | #311 | Tragic $79,543 |
| Immigrants | Haiti | 0.0 /100 | #312 | Tragic $79,391 |
| Menominee | 0.0 /100 | #313 | Tragic $79,358 |
| Cheyenne | 0.0 /100 | #314 | Tragic $79,152 |
| Ottawa | 0.0 /100 | #315 | Tragic $79,012 |
| Africans | 0.0 /100 | #316 | Tragic $78,986 |
| U.S. Virgin Islanders | 0.0 /100 | #317 | Tragic $78,911 |
| Immigrants | Mexico | 0.0 /100 | #318 | Tragic $78,809 |
| Hondurans | 0.0 /100 | #319 | Tragic $78,540 |
| Choctaw | 0.0 /100 | #320 | Tragic $78,168 |
| Immigrants | Zaire | 0.0 /100 | #321 | Tragic $78,045 |