Liberian vs Apache Wage/Income Gap
COMPARE
Liberian
Apache
Wage/Income Gap
Wage/Income Gap Comparison
Liberians
Apache
21.4%
WAGE/INCOME GAP
100.0/ 100
METRIC RATING
41st/ 347
METRIC RANK
24.5%
WAGE/INCOME GAP
94.8/ 100
METRIC RATING
122nd/ 347
METRIC RANK
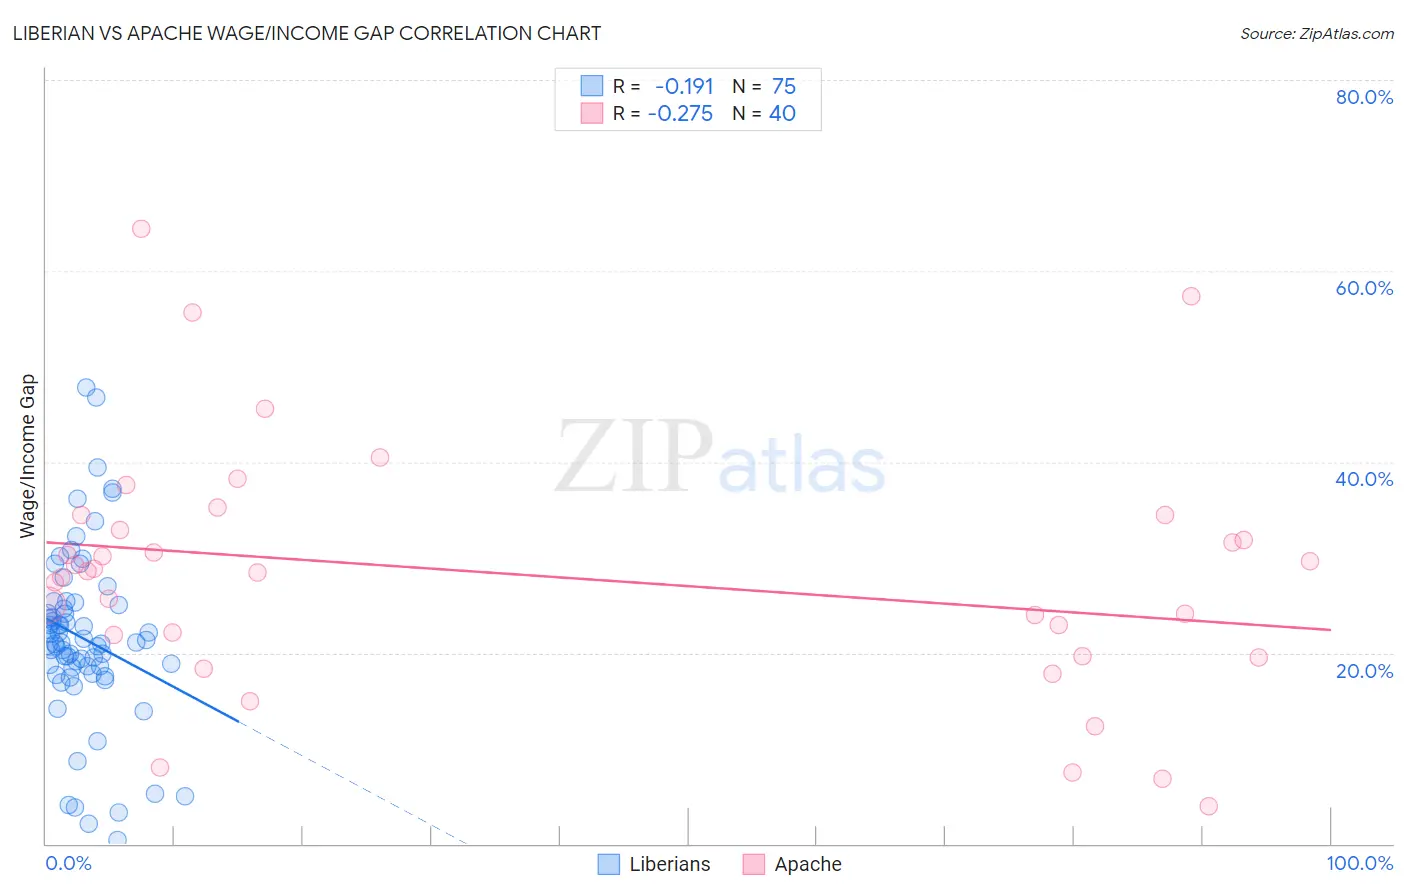
Liberian vs Apache Wage/Income Gap Correlation Chart
The statistical analysis conducted on geographies consisting of 118,089,218 people shows a poor negative correlation between the proportion of Liberians and wage/income gap percentage in the United States with a correlation coefficient (R) of -0.191 and weighted average of 21.4%. Similarly, the statistical analysis conducted on geographies consisting of 230,929,884 people shows a weak negative correlation between the proportion of Apache and wage/income gap percentage in the United States with a correlation coefficient (R) of -0.275 and weighted average of 24.5%, a difference of 14.6%.
Wage/Income Gap Correlation Summary
| Measurement | Liberian | Apache |
| Minimum | 0.44% | 3.9% |
| Maximum | 47.8% | 64.5% |
| Range | 47.4% | 60.6% |
| Mean | 21.5% | 28.1% |
| Median | 21.0% | 28.5% |
| Interquartile 25% (IQ1) | 18.5% | 20.8% |
| Interquartile 75% (IQ3) | 25.0% | 33.7% |
| Interquartile Range (IQR) | 6.5% | 12.9% |
| Standard Deviation (Sample) | 9.0% | 13.0% |
| Standard Deviation (Population) | 9.0% | 12.8% |
Similar Demographics by Wage/Income Gap
Demographics Similar to Liberians by Wage/Income Gap
In terms of wage/income gap, the demographic groups most similar to Liberians are Immigrants from Sierra Leone (21.4%, a difference of 0.0%), Sierra Leonean (21.4%, a difference of 0.060%), Immigrants from Eritrea (21.4%, a difference of 0.080%), Lumbee (21.3%, a difference of 0.48%), and U.S. Virgin Islander (21.5%, a difference of 0.52%).
| Demographics | Rating | Rank | Wage/Income Gap |
| Pima | 100.0 /100 | #34 | Exceptional 21.1% |
| Somalis | 100.0 /100 | #35 | Exceptional 21.2% |
| Belizeans | 100.0 /100 | #36 | Exceptional 21.2% |
| Immigrants | Somalia | 100.0 /100 | #37 | Exceptional 21.2% |
| Immigrants | Belize | 100.0 /100 | #38 | Exceptional 21.3% |
| Colville | 100.0 /100 | #39 | Exceptional 21.3% |
| Lumbee | 100.0 /100 | #40 | Exceptional 21.3% |
| Liberians | 100.0 /100 | #41 | Exceptional 21.4% |
| Immigrants | Sierra Leone | 100.0 /100 | #42 | Exceptional 21.4% |
| Sierra Leoneans | 100.0 /100 | #43 | Exceptional 21.4% |
| Immigrants | Eritrea | 100.0 /100 | #44 | Exceptional 21.4% |
| U.S. Virgin Islanders | 100.0 /100 | #45 | Exceptional 21.5% |
| Immigrants | Ethiopia | 100.0 /100 | #46 | Exceptional 21.6% |
| Immigrants | Congo | 100.0 /100 | #47 | Exceptional 21.7% |
| Blacks/African Americans | 100.0 /100 | #48 | Exceptional 21.7% |
Demographics Similar to Apache by Wage/Income Gap
In terms of wage/income gap, the demographic groups most similar to Apache are Immigrants from Thailand (24.5%, a difference of 0.050%), Native/Alaskan (24.6%, a difference of 0.070%), Immigrants from South America (24.6%, a difference of 0.28%), Spanish American (24.6%, a difference of 0.30%), and Cree (24.5%, a difference of 0.31%).
| Demographics | Rating | Rank | Wage/Income Gap |
| Immigrants | Kenya | 96.4 /100 | #115 | Exceptional 24.4% |
| Alaska Natives | 96.0 /100 | #116 | Exceptional 24.4% |
| Immigrants | Afghanistan | 95.9 /100 | #117 | Exceptional 24.4% |
| Immigrants | Micronesia | 95.8 /100 | #118 | Exceptional 24.4% |
| Kenyans | 95.8 /100 | #119 | Exceptional 24.5% |
| Cree | 95.6 /100 | #120 | Exceptional 24.5% |
| Immigrants | Thailand | 94.9 /100 | #121 | Exceptional 24.5% |
| Apache | 94.8 /100 | #122 | Exceptional 24.5% |
| Natives/Alaskans | 94.6 /100 | #123 | Exceptional 24.6% |
| Immigrants | South America | 93.9 /100 | #124 | Exceptional 24.6% |
| Spanish Americans | 93.8 /100 | #125 | Exceptional 24.6% |
| Immigrants | Uruguay | 93.8 /100 | #126 | Exceptional 24.6% |
| German Russians | 93.7 /100 | #127 | Exceptional 24.6% |
| Immigrants | Central America | 93.5 /100 | #128 | Exceptional 24.6% |
| Yup'ik | 93.3 /100 | #129 | Exceptional 24.7% |