Slovene vs Apache Wage/Income Gap
COMPARE
Slovene
Apache
Wage/Income Gap
Wage/Income Gap Comparison
Slovenes
Apache
28.3%
WAGE/INCOME GAP
0.3/ 100
METRIC RATING
295th/ 347
METRIC RANK
24.5%
WAGE/INCOME GAP
94.8/ 100
METRIC RATING
122nd/ 347
METRIC RANK
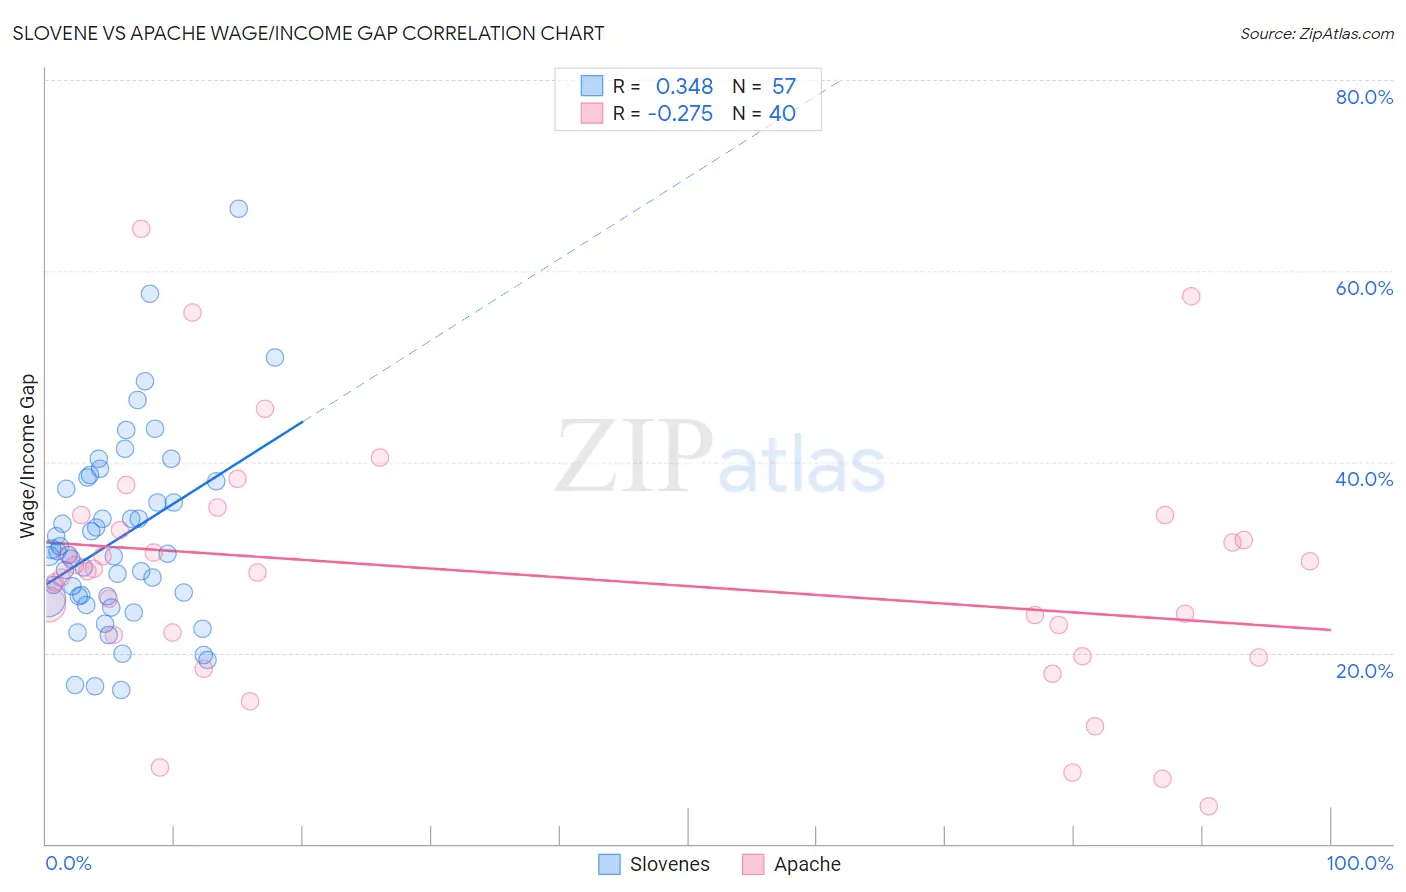
Slovene vs Apache Wage/Income Gap Correlation Chart
The statistical analysis conducted on geographies consisting of 261,240,856 people shows a mild positive correlation between the proportion of Slovenes and wage/income gap percentage in the United States with a correlation coefficient (R) of 0.348 and weighted average of 28.3%. Similarly, the statistical analysis conducted on geographies consisting of 230,929,884 people shows a weak negative correlation between the proportion of Apache and wage/income gap percentage in the United States with a correlation coefficient (R) of -0.275 and weighted average of 24.5%, a difference of 15.2%.
Wage/Income Gap Correlation Summary
| Measurement | Slovene | Apache |
| Minimum | 16.1% | 3.9% |
| Maximum | 66.5% | 64.5% |
| Range | 50.5% | 60.6% |
| Mean | 31.9% | 28.1% |
| Median | 30.2% | 28.5% |
| Interquartile 25% (IQ1) | 25.8% | 20.8% |
| Interquartile 75% (IQ3) | 37.6% | 33.7% |
| Interquartile Range (IQR) | 11.9% | 12.9% |
| Standard Deviation (Sample) | 9.9% | 13.0% |
| Standard Deviation (Population) | 9.8% | 12.8% |
Similar Demographics by Wage/Income Gap
Demographics Similar to Slovenes by Wage/Income Gap
In terms of wage/income gap, the demographic groups most similar to Slovenes are Northern European (28.3%, a difference of 0.0%), Greek (28.2%, a difference of 0.13%), Immigrants from Israel (28.2%, a difference of 0.15%), Immigrants from Australia (28.2%, a difference of 0.26%), and Czechoslovakian (28.2%, a difference of 0.32%).
| Demographics | Rating | Rank | Wage/Income Gap |
| Choctaw | 0.4 /100 | #288 | Tragic 28.1% |
| Canadians | 0.3 /100 | #289 | Tragic 28.1% |
| Australians | 0.3 /100 | #290 | Tragic 28.2% |
| Czechoslovakians | 0.3 /100 | #291 | Tragic 28.2% |
| Immigrants | Australia | 0.3 /100 | #292 | Tragic 28.2% |
| Immigrants | Israel | 0.3 /100 | #293 | Tragic 28.2% |
| Greeks | 0.3 /100 | #294 | Tragic 28.2% |
| Slovenes | 0.3 /100 | #295 | Tragic 28.3% |
| Northern Europeans | 0.3 /100 | #296 | Tragic 28.3% |
| Immigrants | North America | 0.2 /100 | #297 | Tragic 28.4% |
| Austrians | 0.2 /100 | #298 | Tragic 28.4% |
| Immigrants | North Macedonia | 0.2 /100 | #299 | Tragic 28.4% |
| Immigrants | Northern Europe | 0.2 /100 | #300 | Tragic 28.5% |
| Immigrants | Canada | 0.2 /100 | #301 | Tragic 28.5% |
| Scotch-Irish | 0.2 /100 | #302 | Tragic 28.5% |
Demographics Similar to Apache by Wage/Income Gap
In terms of wage/income gap, the demographic groups most similar to Apache are Immigrants from Thailand (24.5%, a difference of 0.050%), Native/Alaskan (24.6%, a difference of 0.070%), Immigrants from South America (24.6%, a difference of 0.28%), Spanish American (24.6%, a difference of 0.30%), and Cree (24.5%, a difference of 0.31%).
| Demographics | Rating | Rank | Wage/Income Gap |
| Immigrants | Kenya | 96.4 /100 | #115 | Exceptional 24.4% |
| Alaska Natives | 96.0 /100 | #116 | Exceptional 24.4% |
| Immigrants | Afghanistan | 95.9 /100 | #117 | Exceptional 24.4% |
| Immigrants | Micronesia | 95.8 /100 | #118 | Exceptional 24.4% |
| Kenyans | 95.8 /100 | #119 | Exceptional 24.5% |
| Cree | 95.6 /100 | #120 | Exceptional 24.5% |
| Immigrants | Thailand | 94.9 /100 | #121 | Exceptional 24.5% |
| Apache | 94.8 /100 | #122 | Exceptional 24.5% |
| Natives/Alaskans | 94.6 /100 | #123 | Exceptional 24.6% |
| Immigrants | South America | 93.9 /100 | #124 | Exceptional 24.6% |
| Spanish Americans | 93.8 /100 | #125 | Exceptional 24.6% |
| Immigrants | Uruguay | 93.8 /100 | #126 | Exceptional 24.6% |
| German Russians | 93.7 /100 | #127 | Exceptional 24.6% |
| Immigrants | Central America | 93.5 /100 | #128 | Exceptional 24.6% |
| Yup'ik | 93.3 /100 | #129 | Exceptional 24.7% |