Hopi vs Apache Wage/Income Gap
COMPARE
Hopi
Apache
Wage/Income Gap
Wage/Income Gap Comparison
Hopi
Apache
20.0%
WAGE/INCOME GAP
100.0/ 100
METRIC RATING
18th/ 347
METRIC RANK
24.5%
WAGE/INCOME GAP
94.8/ 100
METRIC RATING
122nd/ 347
METRIC RANK
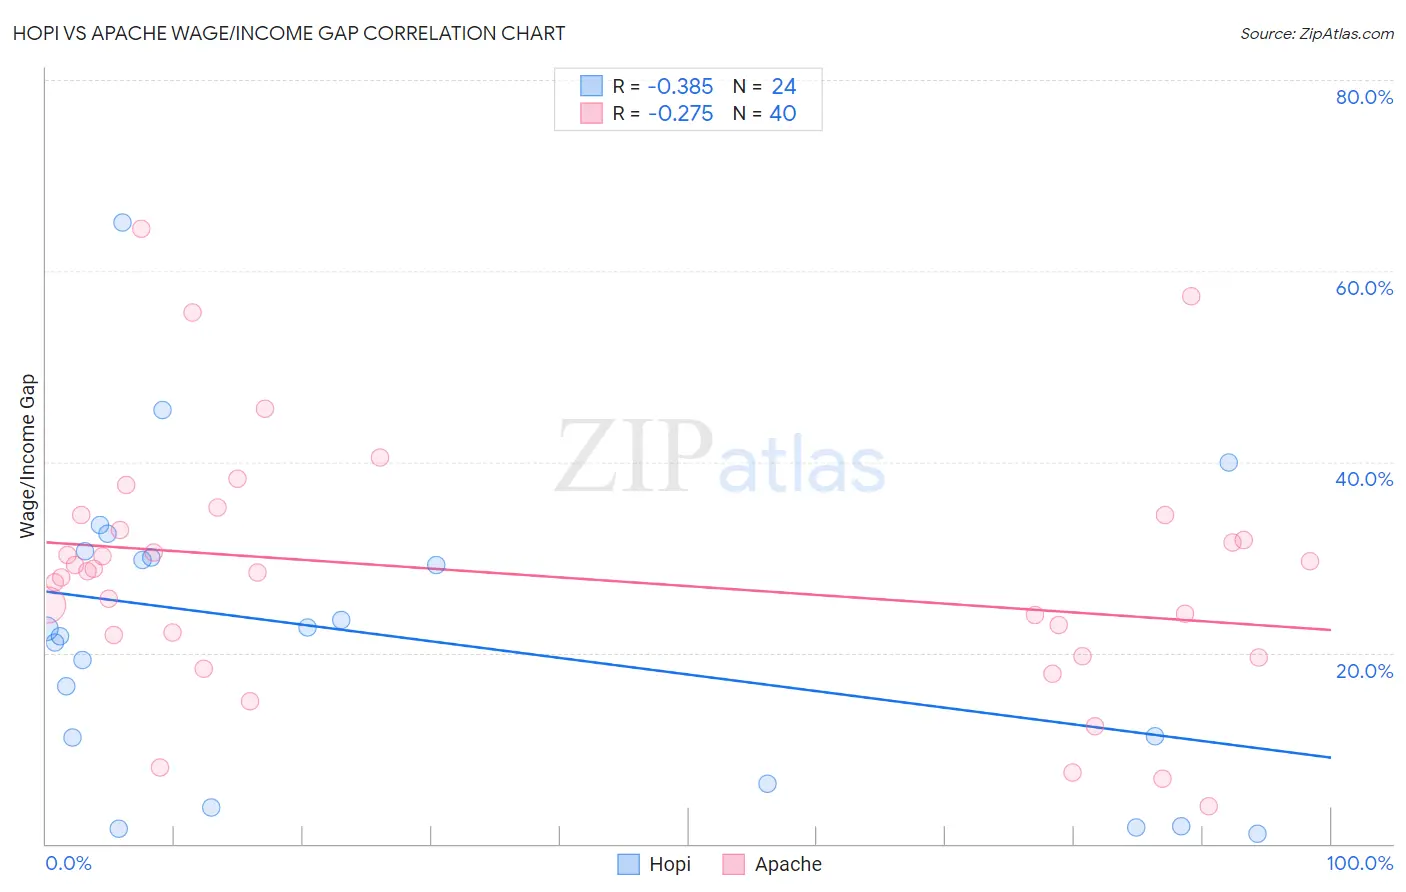
Hopi vs Apache Wage/Income Gap Correlation Chart
The statistical analysis conducted on geographies consisting of 74,717,570 people shows a mild negative correlation between the proportion of Hopi and wage/income gap percentage in the United States with a correlation coefficient (R) of -0.385 and weighted average of 20.0%. Similarly, the statistical analysis conducted on geographies consisting of 230,929,884 people shows a weak negative correlation between the proportion of Apache and wage/income gap percentage in the United States with a correlation coefficient (R) of -0.275 and weighted average of 24.5%, a difference of 22.7%.
Wage/Income Gap Correlation Summary
| Measurement | Hopi | Apache |
| Minimum | 1.1% | 3.9% |
| Maximum | 65.0% | 64.5% |
| Range | 64.0% | 60.6% |
| Mean | 21.7% | 28.1% |
| Median | 22.1% | 28.5% |
| Interquartile 25% (IQ1) | 8.7% | 20.8% |
| Interquartile 75% (IQ3) | 30.3% | 33.7% |
| Interquartile Range (IQR) | 21.6% | 12.9% |
| Standard Deviation (Sample) | 15.8% | 13.0% |
| Standard Deviation (Population) | 15.5% | 12.8% |
Similar Demographics by Wage/Income Gap
Demographics Similar to Hopi by Wage/Income Gap
In terms of wage/income gap, the demographic groups most similar to Hopi are Immigrants from Dominica (20.0%, a difference of 0.060%), Bahamian (20.2%, a difference of 1.2%), Haitian (19.7%, a difference of 1.4%), Immigrants from Caribbean (20.4%, a difference of 1.9%), and Jamaican (19.6%, a difference of 2.2%).
| Demographics | Rating | Rank | Wage/Income Gap |
| Immigrants | Haiti | 100.0 /100 | #11 | Exceptional 19.2% |
| Immigrants | West Indies | 100.0 /100 | #12 | Exceptional 19.2% |
| Trinidadians and Tobagonians | 100.0 /100 | #13 | Exceptional 19.3% |
| Immigrants | Trinidad and Tobago | 100.0 /100 | #14 | Exceptional 19.3% |
| West Indians | 100.0 /100 | #15 | Exceptional 19.6% |
| Jamaicans | 100.0 /100 | #16 | Exceptional 19.6% |
| Haitians | 100.0 /100 | #17 | Exceptional 19.7% |
| Hopi | 100.0 /100 | #18 | Exceptional 20.0% |
| Immigrants | Dominica | 100.0 /100 | #19 | Exceptional 20.0% |
| Bahamians | 100.0 /100 | #20 | Exceptional 20.2% |
| Immigrants | Caribbean | 100.0 /100 | #21 | Exceptional 20.4% |
| Immigrants | Liberia | 100.0 /100 | #22 | Exceptional 20.6% |
| Immigrants | Dominican Republic | 100.0 /100 | #23 | Exceptional 20.6% |
| Dominicans | 100.0 /100 | #24 | Exceptional 20.6% |
| Senegalese | 100.0 /100 | #25 | Exceptional 20.7% |
Demographics Similar to Apache by Wage/Income Gap
In terms of wage/income gap, the demographic groups most similar to Apache are Immigrants from Thailand (24.5%, a difference of 0.050%), Native/Alaskan (24.6%, a difference of 0.070%), Immigrants from South America (24.6%, a difference of 0.28%), Spanish American (24.6%, a difference of 0.30%), and Cree (24.5%, a difference of 0.31%).
| Demographics | Rating | Rank | Wage/Income Gap |
| Immigrants | Kenya | 96.4 /100 | #115 | Exceptional 24.4% |
| Alaska Natives | 96.0 /100 | #116 | Exceptional 24.4% |
| Immigrants | Afghanistan | 95.9 /100 | #117 | Exceptional 24.4% |
| Immigrants | Micronesia | 95.8 /100 | #118 | Exceptional 24.4% |
| Kenyans | 95.8 /100 | #119 | Exceptional 24.5% |
| Cree | 95.6 /100 | #120 | Exceptional 24.5% |
| Immigrants | Thailand | 94.9 /100 | #121 | Exceptional 24.5% |
| Apache | 94.8 /100 | #122 | Exceptional 24.5% |
| Natives/Alaskans | 94.6 /100 | #123 | Exceptional 24.6% |
| Immigrants | South America | 93.9 /100 | #124 | Exceptional 24.6% |
| Spanish Americans | 93.8 /100 | #125 | Exceptional 24.6% |
| Immigrants | Uruguay | 93.8 /100 | #126 | Exceptional 24.6% |
| German Russians | 93.7 /100 | #127 | Exceptional 24.6% |
| Immigrants | Central America | 93.5 /100 | #128 | Exceptional 24.6% |
| Yup'ik | 93.3 /100 | #129 | Exceptional 24.7% |