Estonian vs Apache Wage/Income Gap
COMPARE
Estonian
Apache
Wage/Income Gap
Wage/Income Gap Comparison
Estonians
Apache
27.1%
WAGE/INCOME GAP
4.3/ 100
METRIC RATING
239th/ 347
METRIC RANK
24.5%
WAGE/INCOME GAP
94.8/ 100
METRIC RATING
122nd/ 347
METRIC RANK
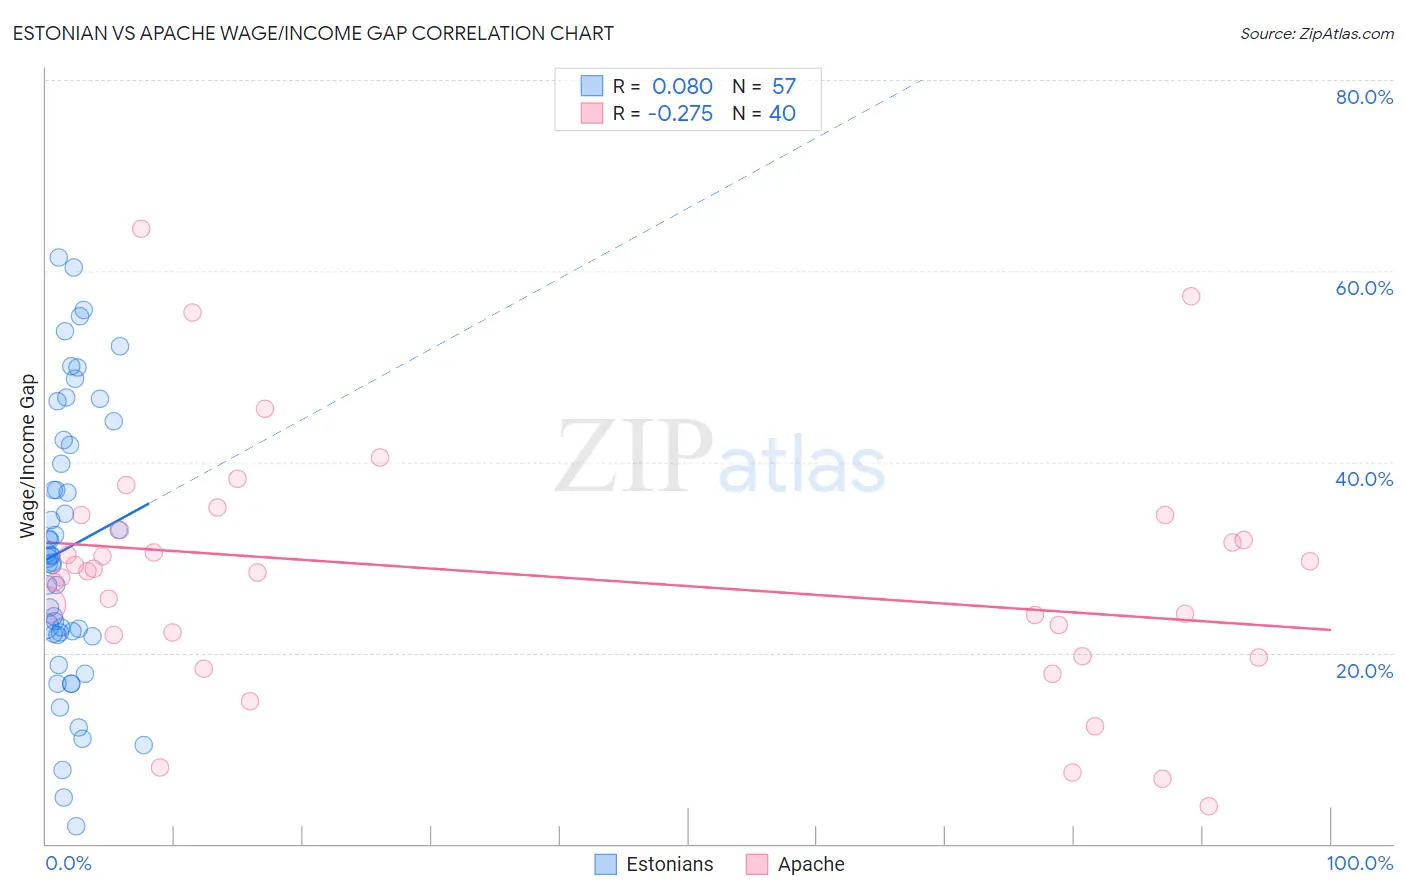
Estonian vs Apache Wage/Income Gap Correlation Chart
The statistical analysis conducted on geographies consisting of 123,494,549 people shows a slight positive correlation between the proportion of Estonians and wage/income gap percentage in the United States with a correlation coefficient (R) of 0.080 and weighted average of 27.1%. Similarly, the statistical analysis conducted on geographies consisting of 230,929,884 people shows a weak negative correlation between the proportion of Apache and wage/income gap percentage in the United States with a correlation coefficient (R) of -0.275 and weighted average of 24.5%, a difference of 10.3%.
Wage/Income Gap Correlation Summary
| Measurement | Estonian | Apache |
| Minimum | 1.9% | 3.9% |
| Maximum | 61.4% | 64.5% |
| Range | 59.5% | 60.6% |
| Mean | 31.0% | 28.1% |
| Median | 29.9% | 28.5% |
| Interquartile 25% (IQ1) | 22.0% | 20.8% |
| Interquartile 75% (IQ3) | 42.0% | 33.7% |
| Interquartile Range (IQR) | 20.1% | 12.9% |
| Standard Deviation (Sample) | 14.4% | 13.0% |
| Standard Deviation (Population) | 14.3% | 12.8% |
Similar Demographics by Wage/Income Gap
Demographics Similar to Estonians by Wage/Income Gap
In terms of wage/income gap, the demographic groups most similar to Estonians are Osage (27.1%, a difference of 0.020%), Immigrants from Eastern Asia (27.1%, a difference of 0.030%), Immigrants from Romania (27.0%, a difference of 0.17%), Immigrants from Europe (27.1%, a difference of 0.18%), and Immigrants from Hungary (27.0%, a difference of 0.19%).
| Demographics | Rating | Rank | Wage/Income Gap |
| Argentineans | 5.2 /100 | #232 | Tragic 27.0% |
| Immigrants | Brazil | 5.0 /100 | #233 | Tragic 27.0% |
| Immigrants | Pakistan | 4.9 /100 | #234 | Tragic 27.0% |
| Immigrants | Hungary | 4.8 /100 | #235 | Tragic 27.0% |
| Immigrants | Romania | 4.8 /100 | #236 | Tragic 27.0% |
| Immigrants | Eastern Asia | 4.4 /100 | #237 | Tragic 27.1% |
| Osage | 4.4 /100 | #238 | Tragic 27.1% |
| Estonians | 4.3 /100 | #239 | Tragic 27.1% |
| Immigrants | Europe | 3.8 /100 | #240 | Tragic 27.1% |
| Creek | 3.8 /100 | #241 | Tragic 27.1% |
| Immigrants | Sri Lanka | 3.7 /100 | #242 | Tragic 27.1% |
| Spanish | 3.6 /100 | #243 | Tragic 27.1% |
| Chickasaw | 3.5 /100 | #244 | Tragic 27.2% |
| Immigrants | Azores | 3.5 /100 | #245 | Tragic 27.2% |
| Immigrants | Nonimmigrants | 3.3 /100 | #246 | Tragic 27.2% |
Demographics Similar to Apache by Wage/Income Gap
In terms of wage/income gap, the demographic groups most similar to Apache are Immigrants from Thailand (24.5%, a difference of 0.050%), Native/Alaskan (24.6%, a difference of 0.070%), Immigrants from South America (24.6%, a difference of 0.28%), Spanish American (24.6%, a difference of 0.30%), and Cree (24.5%, a difference of 0.31%).
| Demographics | Rating | Rank | Wage/Income Gap |
| Immigrants | Kenya | 96.4 /100 | #115 | Exceptional 24.4% |
| Alaska Natives | 96.0 /100 | #116 | Exceptional 24.4% |
| Immigrants | Afghanistan | 95.9 /100 | #117 | Exceptional 24.4% |
| Immigrants | Micronesia | 95.8 /100 | #118 | Exceptional 24.4% |
| Kenyans | 95.8 /100 | #119 | Exceptional 24.5% |
| Cree | 95.6 /100 | #120 | Exceptional 24.5% |
| Immigrants | Thailand | 94.9 /100 | #121 | Exceptional 24.5% |
| Apache | 94.8 /100 | #122 | Exceptional 24.5% |
| Natives/Alaskans | 94.6 /100 | #123 | Exceptional 24.6% |
| Immigrants | South America | 93.9 /100 | #124 | Exceptional 24.6% |
| Spanish Americans | 93.8 /100 | #125 | Exceptional 24.6% |
| Immigrants | Uruguay | 93.8 /100 | #126 | Exceptional 24.6% |
| German Russians | 93.7 /100 | #127 | Exceptional 24.6% |
| Immigrants | Central America | 93.5 /100 | #128 | Exceptional 24.6% |
| Yup'ik | 93.3 /100 | #129 | Exceptional 24.7% |