Immigrants from Kazakhstan vs Apache Wage/Income Gap
COMPARE
Immigrants from Kazakhstan
Apache
Wage/Income Gap
Wage/Income Gap Comparison
Immigrants from Kazakhstan
Apache
26.0%
WAGE/INCOME GAP
35.2/ 100
METRIC RATING
183rd/ 347
METRIC RANK
24.5%
WAGE/INCOME GAP
94.8/ 100
METRIC RATING
122nd/ 347
METRIC RANK
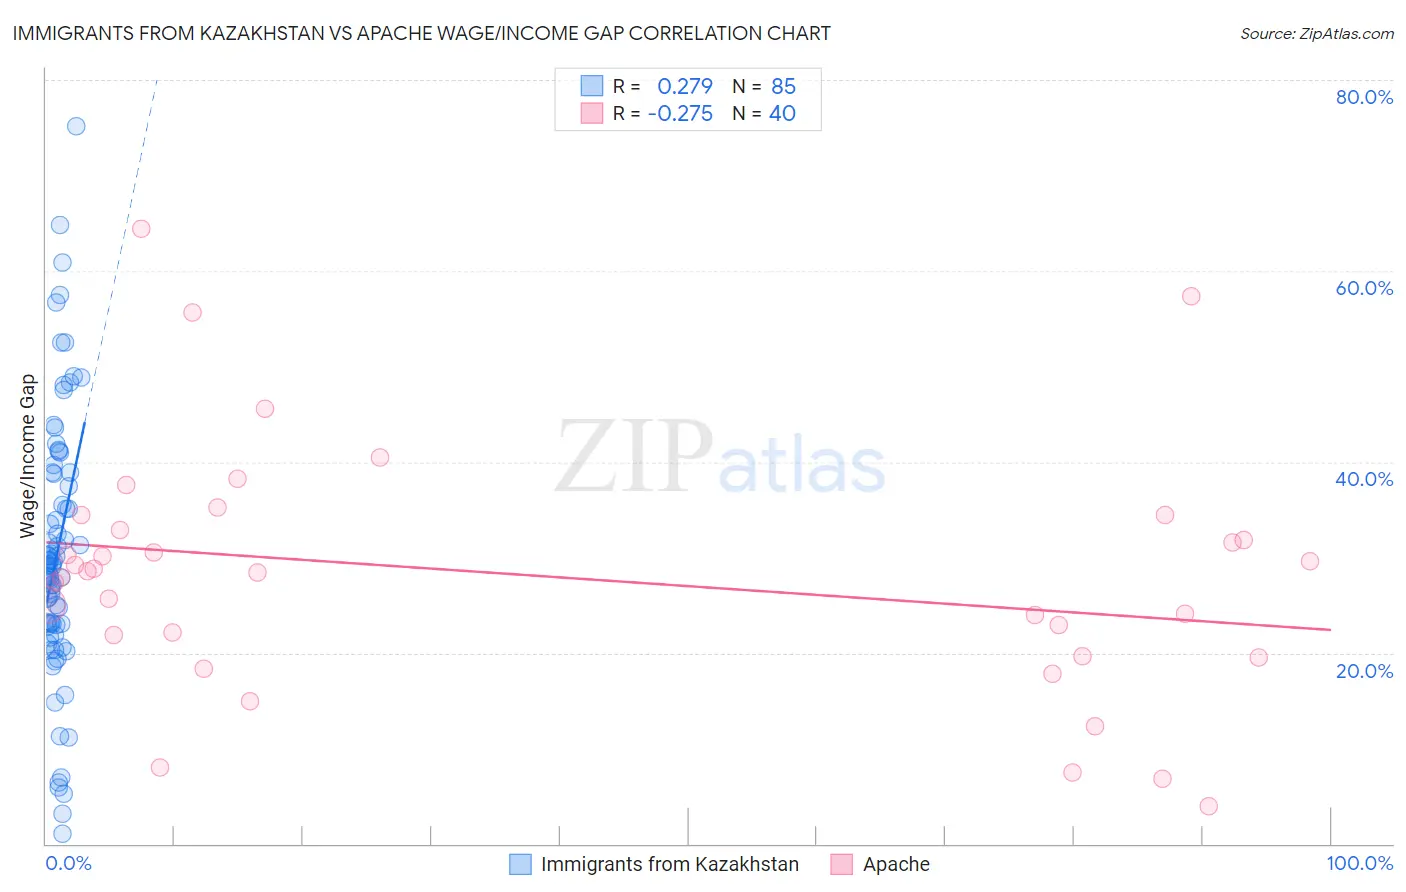
Immigrants from Kazakhstan vs Apache Wage/Income Gap Correlation Chart
The statistical analysis conducted on geographies consisting of 124,424,213 people shows a weak positive correlation between the proportion of Immigrants from Kazakhstan and wage/income gap percentage in the United States with a correlation coefficient (R) of 0.279 and weighted average of 26.0%. Similarly, the statistical analysis conducted on geographies consisting of 230,929,884 people shows a weak negative correlation between the proportion of Apache and wage/income gap percentage in the United States with a correlation coefficient (R) of -0.275 and weighted average of 24.5%, a difference of 6.0%.
Wage/Income Gap Correlation Summary
| Measurement | Immigrants from Kazakhstan | Apache |
| Minimum | 1.1% | 3.9% |
| Maximum | 75.1% | 64.5% |
| Range | 74.1% | 60.6% |
| Mean | 30.4% | 28.1% |
| Median | 29.1% | 28.5% |
| Interquartile 25% (IQ1) | 22.9% | 20.8% |
| Interquartile 75% (IQ3) | 38.8% | 33.7% |
| Interquartile Range (IQR) | 15.9% | 12.9% |
| Standard Deviation (Sample) | 13.9% | 13.0% |
| Standard Deviation (Population) | 13.8% | 12.8% |
Similar Demographics by Wage/Income Gap
Demographics Similar to Immigrants from Kazakhstan by Wage/Income Gap
In terms of wage/income gap, the demographic groups most similar to Immigrants from Kazakhstan are Immigrants from Serbia (26.0%, a difference of 0.010%), Mexican (26.0%, a difference of 0.060%), Immigrants from Bolivia (26.0%, a difference of 0.090%), Pakistani (26.1%, a difference of 0.11%), and Immigrants from Indonesia (26.1%, a difference of 0.19%).
| Demographics | Rating | Rank | Wage/Income Gap |
| Paraguayans | 46.7 /100 | #176 | Average 25.8% |
| Cambodians | 45.1 /100 | #177 | Average 25.8% |
| Chinese | 42.0 /100 | #178 | Average 25.9% |
| Samoans | 38.6 /100 | #179 | Fair 26.0% |
| Guamanians/Chamorros | 38.0 /100 | #180 | Fair 26.0% |
| Immigrants | Bolivia | 36.4 /100 | #181 | Fair 26.0% |
| Immigrants | Serbia | 35.4 /100 | #182 | Fair 26.0% |
| Immigrants | Kazakhstan | 35.2 /100 | #183 | Fair 26.0% |
| Mexicans | 34.4 /100 | #184 | Fair 26.0% |
| Pakistanis | 33.7 /100 | #185 | Fair 26.1% |
| Immigrants | Indonesia | 32.5 /100 | #186 | Fair 26.1% |
| Palestinians | 29.9 /100 | #187 | Fair 26.1% |
| Immigrants | Egypt | 29.9 /100 | #188 | Fair 26.1% |
| Immigrants | Moldova | 26.6 /100 | #189 | Fair 26.2% |
| Immigrants | Croatia | 24.8 /100 | #190 | Fair 26.2% |
Demographics Similar to Apache by Wage/Income Gap
In terms of wage/income gap, the demographic groups most similar to Apache are Immigrants from Thailand (24.5%, a difference of 0.050%), Native/Alaskan (24.6%, a difference of 0.070%), Immigrants from South America (24.6%, a difference of 0.28%), Spanish American (24.6%, a difference of 0.30%), and Cree (24.5%, a difference of 0.31%).
| Demographics | Rating | Rank | Wage/Income Gap |
| Immigrants | Kenya | 96.4 /100 | #115 | Exceptional 24.4% |
| Alaska Natives | 96.0 /100 | #116 | Exceptional 24.4% |
| Immigrants | Afghanistan | 95.9 /100 | #117 | Exceptional 24.4% |
| Immigrants | Micronesia | 95.8 /100 | #118 | Exceptional 24.4% |
| Kenyans | 95.8 /100 | #119 | Exceptional 24.5% |
| Cree | 95.6 /100 | #120 | Exceptional 24.5% |
| Immigrants | Thailand | 94.9 /100 | #121 | Exceptional 24.5% |
| Apache | 94.8 /100 | #122 | Exceptional 24.5% |
| Natives/Alaskans | 94.6 /100 | #123 | Exceptional 24.6% |
| Immigrants | South America | 93.9 /100 | #124 | Exceptional 24.6% |
| Spanish Americans | 93.8 /100 | #125 | Exceptional 24.6% |
| Immigrants | Uruguay | 93.8 /100 | #126 | Exceptional 24.6% |
| German Russians | 93.7 /100 | #127 | Exceptional 24.6% |
| Immigrants | Central America | 93.5 /100 | #128 | Exceptional 24.6% |
| Yup'ik | 93.3 /100 | #129 | Exceptional 24.7% |