Comanche vs Apache Median Female Earnings
COMPARE
Comanche
Apache
Median Female Earnings
Median Female Earnings Comparison
Comanche
Apache
$35,661
MEDIAN FEMALE EARNINGS
0.0/ 100
METRIC RATING
295th/ 347
METRIC RANK
$34,895
MEDIAN FEMALE EARNINGS
0.0/ 100
METRIC RATING
314th/ 347
METRIC RANK
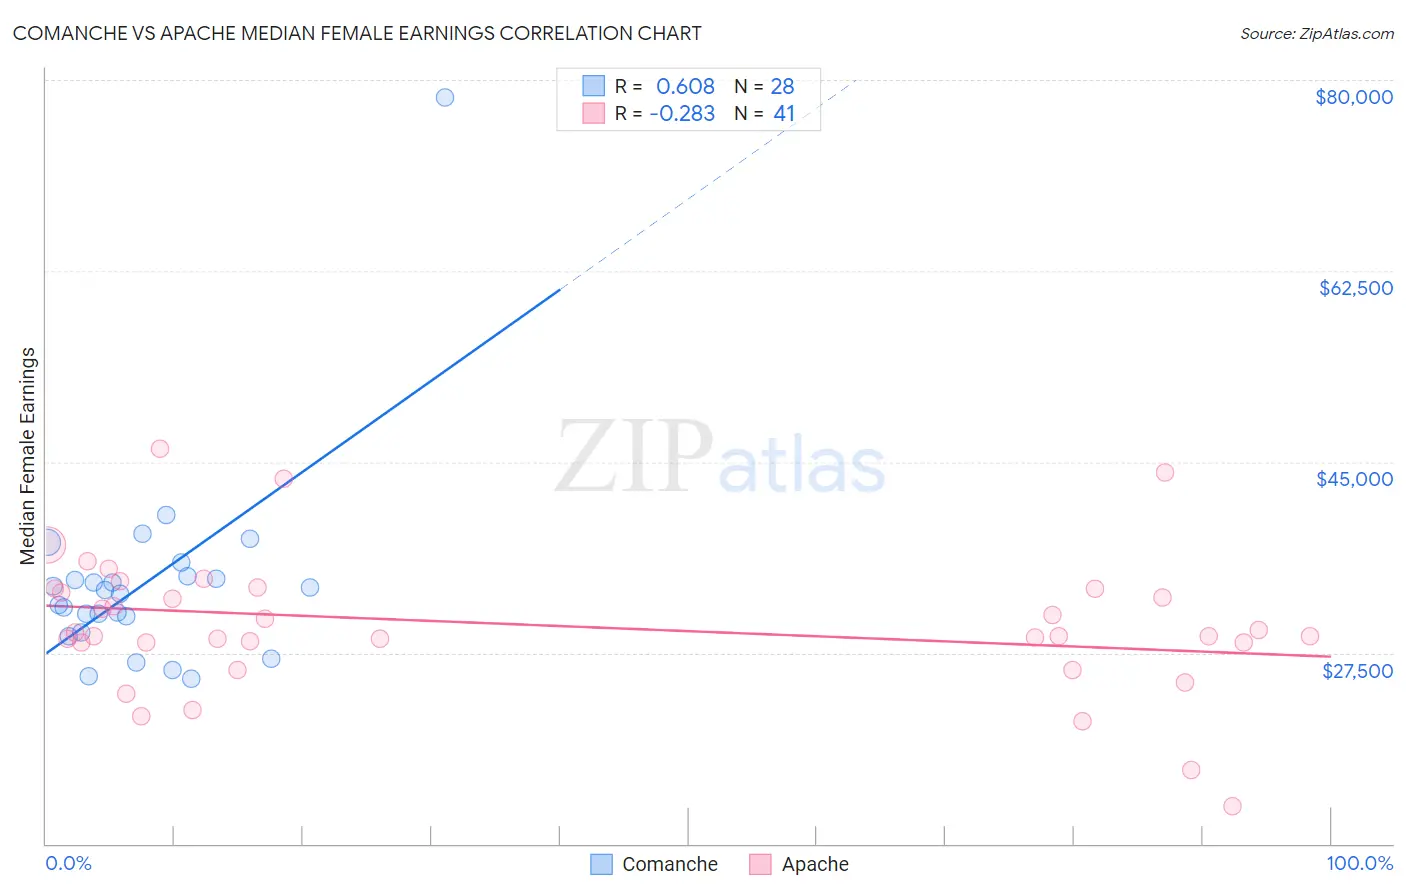
Comanche vs Apache Median Female Earnings Correlation Chart
The statistical analysis conducted on geographies consisting of 109,756,357 people shows a significant positive correlation between the proportion of Comanche and median female earnings in the United States with a correlation coefficient (R) of 0.608 and weighted average of $35,661. Similarly, the statistical analysis conducted on geographies consisting of 230,997,872 people shows a weak negative correlation between the proportion of Apache and median female earnings in the United States with a correlation coefficient (R) of -0.283 and weighted average of $34,895, a difference of 2.2%.
Median Female Earnings Correlation Summary
| Measurement | Comanche | Apache |
| Minimum | $25,100 | $13,381 |
| Maximum | $78,452 | $46,250 |
| Range | $53,352 | $32,869 |
| Mean | $33,877 | $30,090 |
| Median | $33,076 | $29,044 |
| Interquartile 25% (IQ1) | $30,131 | $28,433 |
| Interquartile 75% (IQ3) | $34,372 | $33,369 |
| Interquartile Range (IQR) | $4,241 | $4,936 |
| Standard Deviation (Sample) | $9,585 | $6,387 |
| Standard Deviation (Population) | $9,413 | $6,309 |
Demographics Similar to Comanche and Apache by Median Female Earnings
In terms of median female earnings, the demographic groups most similar to Comanche are Cheyenne ($35,673, a difference of 0.030%), Mexican American Indian ($35,629, a difference of 0.090%), Hmong ($35,498, a difference of 0.46%), Immigrants from Micronesia ($35,477, a difference of 0.52%), and Immigrants from Guatemala ($35,444, a difference of 0.61%). Similarly, the demographic groups most similar to Apache are Cuban ($34,942, a difference of 0.13%), Yaqui ($34,943, a difference of 0.14%), Ute ($34,960, a difference of 0.19%), Chippewa ($35,003, a difference of 0.31%), and Honduran ($35,013, a difference of 0.34%).
| Demographics | Rating | Rank | Median Female Earnings |
| Cheyenne | 0.0 /100 | #294 | Tragic $35,673 |
| Comanche | 0.0 /100 | #295 | Tragic $35,661 |
| Mexican American Indians | 0.0 /100 | #296 | Tragic $35,629 |
| Hmong | 0.0 /100 | #297 | Tragic $35,498 |
| Immigrants | Micronesia | 0.0 /100 | #298 | Tragic $35,477 |
| Immigrants | Guatemala | 0.0 /100 | #299 | Tragic $35,444 |
| Yuman | 0.0 /100 | #300 | Tragic $35,377 |
| Pima | 0.0 /100 | #301 | Tragic $35,326 |
| Blacks/African Americans | 0.0 /100 | #302 | Tragic $35,315 |
| Immigrants | Latin America | 0.0 /100 | #303 | Tragic $35,307 |
| Crow | 0.0 /100 | #304 | Tragic $35,266 |
| Bahamians | 0.0 /100 | #305 | Tragic $35,125 |
| Fijians | 0.0 /100 | #306 | Tragic $35,114 |
| Sioux | 0.0 /100 | #307 | Tragic $35,063 |
| Immigrants | Bahamas | 0.0 /100 | #308 | Tragic $35,027 |
| Hondurans | 0.0 /100 | #309 | Tragic $35,013 |
| Chippewa | 0.0 /100 | #310 | Tragic $35,003 |
| Ute | 0.0 /100 | #311 | Tragic $34,960 |
| Yaqui | 0.0 /100 | #312 | Tragic $34,943 |
| Cubans | 0.0 /100 | #313 | Tragic $34,942 |
| Apache | 0.0 /100 | #314 | Tragic $34,895 |