Armenian vs Apache Wage/Income Gap
COMPARE
Armenian
Apache
Wage/Income Gap
Wage/Income Gap Comparison
Armenians
Apache
24.8%
WAGE/INCOME GAP
91.3/ 100
METRIC RATING
136th/ 347
METRIC RANK
24.5%
WAGE/INCOME GAP
94.8/ 100
METRIC RATING
122nd/ 347
METRIC RANK
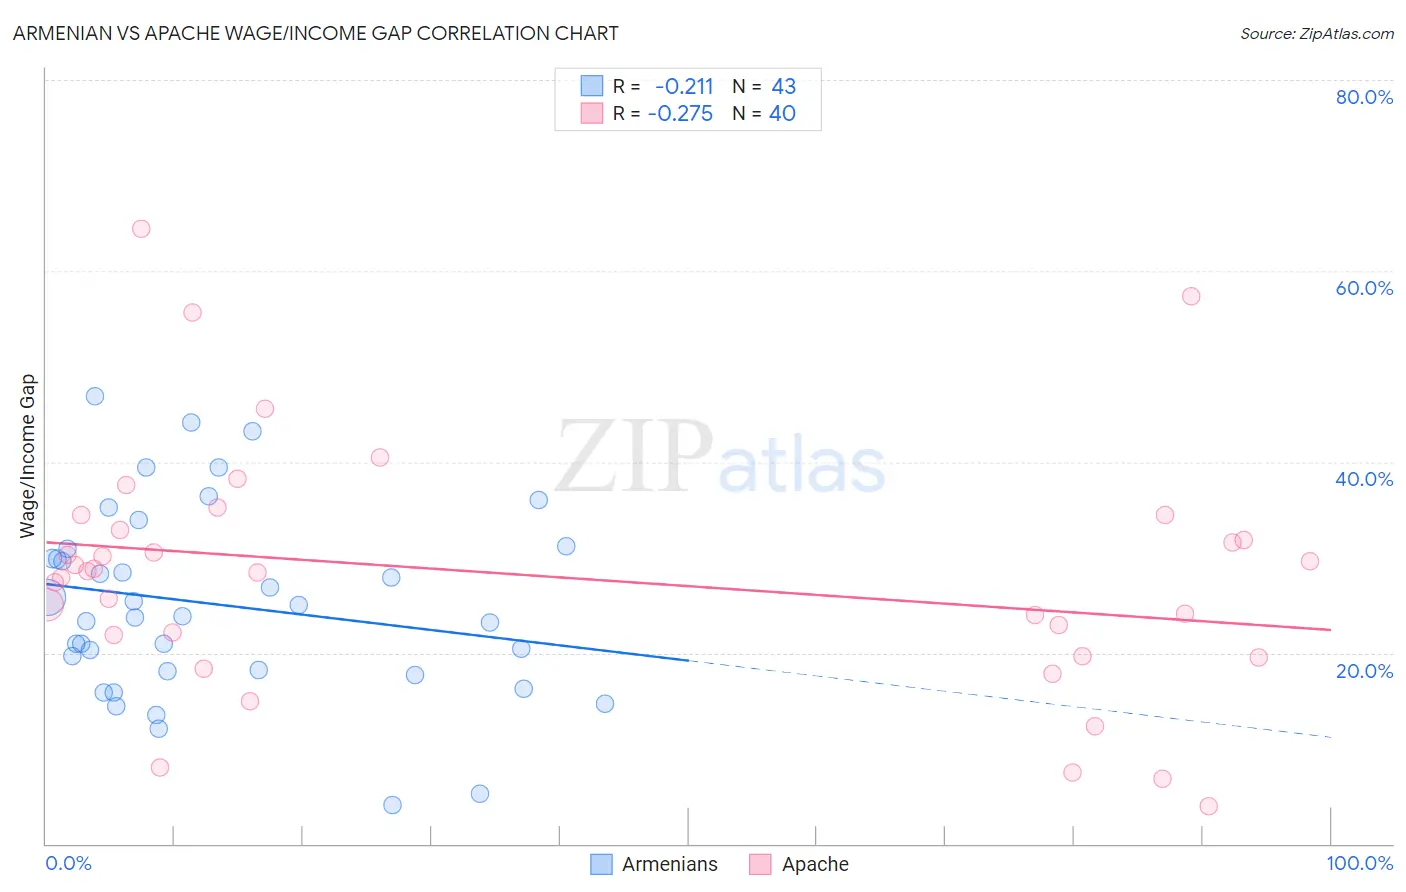
Armenian vs Apache Wage/Income Gap Correlation Chart
The statistical analysis conducted on geographies consisting of 310,772,070 people shows a weak negative correlation between the proportion of Armenians and wage/income gap percentage in the United States with a correlation coefficient (R) of -0.211 and weighted average of 24.8%. Similarly, the statistical analysis conducted on geographies consisting of 230,929,884 people shows a weak negative correlation between the proportion of Apache and wage/income gap percentage in the United States with a correlation coefficient (R) of -0.275 and weighted average of 24.5%, a difference of 0.93%.
Wage/Income Gap Correlation Summary
| Measurement | Armenian | Apache |
| Minimum | 4.0% | 3.9% |
| Maximum | 46.9% | 64.5% |
| Range | 42.9% | 60.6% |
| Mean | 25.0% | 28.1% |
| Median | 23.9% | 28.5% |
| Interquartile 25% (IQ1) | 18.0% | 20.8% |
| Interquartile 75% (IQ3) | 30.9% | 33.7% |
| Interquartile Range (IQR) | 12.9% | 12.9% |
| Standard Deviation (Sample) | 9.9% | 13.0% |
| Standard Deviation (Population) | 9.7% | 12.8% |
Demographics Similar to Armenians and Apache by Wage/Income Gap
In terms of wage/income gap, the demographic groups most similar to Armenians are Immigrants from South Eastern Asia (24.8%, a difference of 0.080%), South American Indian (24.7%, a difference of 0.14%), Mexican American Indian (24.7%, a difference of 0.20%), Immigrants from Costa Rica (24.7%, a difference of 0.24%), and Colombian (24.7%, a difference of 0.24%). Similarly, the demographic groups most similar to Apache are Immigrants from Thailand (24.5%, a difference of 0.050%), Native/Alaskan (24.6%, a difference of 0.070%), Immigrants from South America (24.6%, a difference of 0.28%), Spanish American (24.6%, a difference of 0.30%), and Cree (24.5%, a difference of 0.31%).
| Demographics | Rating | Rank | Wage/Income Gap |
| Kenyans | 95.8 /100 | #119 | Exceptional 24.5% |
| Cree | 95.6 /100 | #120 | Exceptional 24.5% |
| Immigrants | Thailand | 94.9 /100 | #121 | Exceptional 24.5% |
| Apache | 94.8 /100 | #122 | Exceptional 24.5% |
| Natives/Alaskans | 94.6 /100 | #123 | Exceptional 24.6% |
| Immigrants | South America | 93.9 /100 | #124 | Exceptional 24.6% |
| Spanish Americans | 93.8 /100 | #125 | Exceptional 24.6% |
| Immigrants | Uruguay | 93.8 /100 | #126 | Exceptional 24.6% |
| German Russians | 93.7 /100 | #127 | Exceptional 24.6% |
| Immigrants | Central America | 93.5 /100 | #128 | Exceptional 24.6% |
| Yup'ik | 93.3 /100 | #129 | Exceptional 24.7% |
| Alsatians | 93.2 /100 | #130 | Exceptional 24.7% |
| Immigrants | Philippines | 93.0 /100 | #131 | Exceptional 24.7% |
| Immigrants | Costa Rica | 92.4 /100 | #132 | Exceptional 24.7% |
| Colombians | 92.4 /100 | #133 | Exceptional 24.7% |
| Mexican American Indians | 92.2 /100 | #134 | Exceptional 24.7% |
| South American Indians | 92.0 /100 | #135 | Exceptional 24.7% |
| Armenians | 91.3 /100 | #136 | Exceptional 24.8% |
| Immigrants | South Eastern Asia | 90.9 /100 | #137 | Exceptional 24.8% |
| Immigrants | Bosnia and Herzegovina | 90.1 /100 | #138 | Exceptional 24.8% |
| Hispanics or Latinos | 89.5 /100 | #139 | Excellent 24.9% |