Black/African American vs Zimbabwean Disability Age 18 to 34
COMPARE
Black/African American
Zimbabwean
Disability Age 18 to 34
Disability Age 18 to 34 Comparison
Blacks/African Americans
Zimbabweans
7.7%
DISABILITY AGE 18 TO 34
0.0/ 100
METRIC RATING
292nd/ 347
METRIC RANK
6.5%
DISABILITY AGE 18 TO 34
74.7/ 100
METRIC RATING
158th/ 347
METRIC RANK
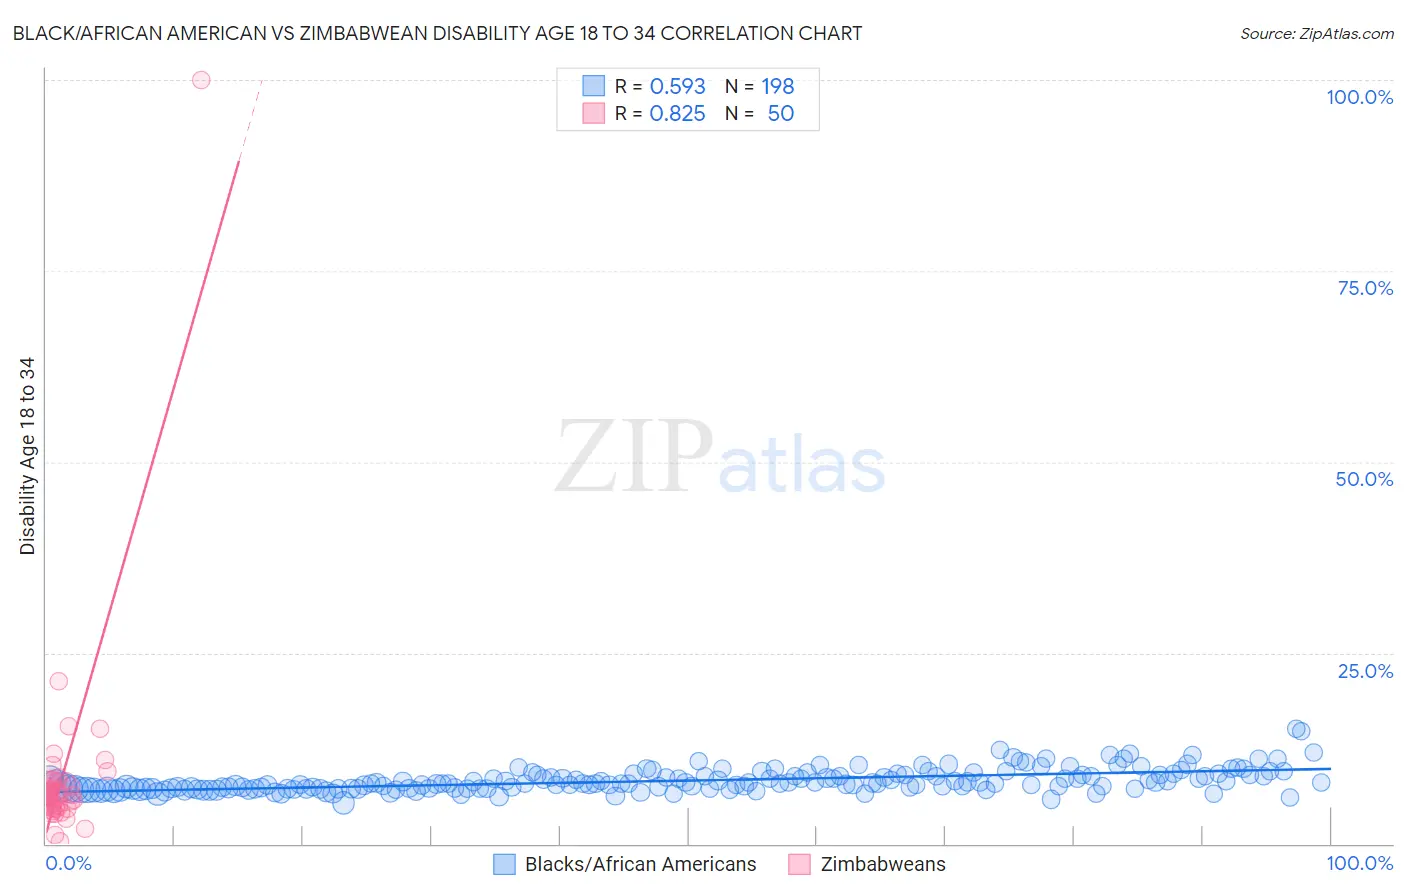
Black/African American vs Zimbabwean Disability Age 18 to 34 Correlation Chart
The statistical analysis conducted on geographies consisting of 561,495,678 people shows a substantial positive correlation between the proportion of Blacks/African Americans and percentage of population with a disability between the ages 18 and 35 in the United States with a correlation coefficient (R) of 0.593 and weighted average of 7.7%. Similarly, the statistical analysis conducted on geographies consisting of 69,205,291 people shows a very strong positive correlation between the proportion of Zimbabweans and percentage of population with a disability between the ages 18 and 35 in the United States with a correlation coefficient (R) of 0.825 and weighted average of 6.5%, a difference of 18.5%.
Disability Age 18 to 34 Correlation Summary
| Measurement | Black/African American | Zimbabwean |
| Minimum | 5.3% | 0.28% |
| Maximum | 15.1% | 100.0% |
| Range | 9.7% | 99.7% |
| Mean | 8.3% | 8.7% |
| Median | 7.9% | 6.3% |
| Interquartile 25% (IQ1) | 7.2% | 5.0% |
| Interquartile 75% (IQ3) | 9.0% | 8.1% |
| Interquartile Range (IQR) | 1.8% | 3.1% |
| Standard Deviation (Sample) | 1.5% | 13.6% |
| Standard Deviation (Population) | 1.5% | 13.5% |
Similar Demographics by Disability Age 18 to 34
Demographics Similar to Blacks/African Americans by Disability Age 18 to 34
In terms of disability age 18 to 34, the demographic groups most similar to Blacks/African Americans are Scandinavian (7.7%, a difference of 0.060%), Immigrants from Cabo Verde (7.7%, a difference of 0.21%), Irish (7.7%, a difference of 0.22%), Tlingit-Haida (7.7%, a difference of 0.22%), and Slovak (7.7%, a difference of 0.27%).
| Demographics | Rating | Rank | Disability Age 18 to 34 |
| Swedes | 0.0 /100 | #285 | Tragic 7.5% |
| Celtics | 0.0 /100 | #286 | Tragic 7.6% |
| Norwegians | 0.0 /100 | #287 | Tragic 7.6% |
| Whites/Caucasians | 0.0 /100 | #288 | Tragic 7.6% |
| Immigrants | Nonimmigrants | 0.0 /100 | #289 | Tragic 7.6% |
| Slovaks | 0.0 /100 | #290 | Tragic 7.7% |
| Irish | 0.0 /100 | #291 | Tragic 7.7% |
| Blacks/African Americans | 0.0 /100 | #292 | Tragic 7.7% |
| Scandinavians | 0.0 /100 | #293 | Tragic 7.7% |
| Immigrants | Cabo Verde | 0.0 /100 | #294 | Tragic 7.7% |
| Tlingit-Haida | 0.0 /100 | #295 | Tragic 7.7% |
| Cape Verdeans | 0.0 /100 | #296 | Tragic 7.7% |
| Pueblo | 0.0 /100 | #297 | Tragic 7.7% |
| Dutch | 0.0 /100 | #298 | Tragic 7.7% |
| Germans | 0.0 /100 | #299 | Tragic 7.7% |
Demographics Similar to Zimbabweans by Disability Age 18 to 34
In terms of disability age 18 to 34, the demographic groups most similar to Zimbabweans are Immigrants from Sierra Leone (6.5%, a difference of 0.030%), Immigrants from Panama (6.5%, a difference of 0.060%), Dominican (6.5%, a difference of 0.11%), Inupiat (6.5%, a difference of 0.19%), and Immigrants from Central America (6.5%, a difference of 0.20%).
| Demographics | Rating | Rank | Disability Age 18 to 34 |
| Tongans | 81.9 /100 | #151 | Excellent 6.4% |
| Bulgarians | 78.3 /100 | #152 | Good 6.5% |
| Immigrants | Eritrea | 77.4 /100 | #153 | Good 6.5% |
| Immigrants | Central America | 76.8 /100 | #154 | Good 6.5% |
| Inupiat | 76.7 /100 | #155 | Good 6.5% |
| Immigrants | Panama | 75.3 /100 | #156 | Good 6.5% |
| Immigrants | Sierra Leone | 75.0 /100 | #157 | Good 6.5% |
| Zimbabweans | 74.7 /100 | #158 | Good 6.5% |
| Dominicans | 73.6 /100 | #159 | Good 6.5% |
| Immigrants | Southern Europe | 72.5 /100 | #160 | Good 6.5% |
| Arabs | 72.3 /100 | #161 | Good 6.5% |
| South Africans | 71.7 /100 | #162 | Good 6.5% |
| Immigrants | Denmark | 71.7 /100 | #163 | Good 6.5% |
| Immigrants | Nigeria | 70.4 /100 | #164 | Good 6.5% |
| Immigrants | Hungary | 69.6 /100 | #165 | Good 6.5% |