Black/African American vs Zimbabwean In Labor Force | Age 16-19
COMPARE
Black/African American
Zimbabwean
In Labor Force | Age 16-19
In Labor Force | Age 16-19 Comparison
Blacks/African Americans
Zimbabweans
36.5%
IN LABOR FORCE | AGE 16-19
45.1/ 100
METRIC RATING
178th/ 347
METRIC RANK
38.7%
IN LABOR FORCE | AGE 16-19
99.1/ 100
METRIC RATING
102nd/ 347
METRIC RANK
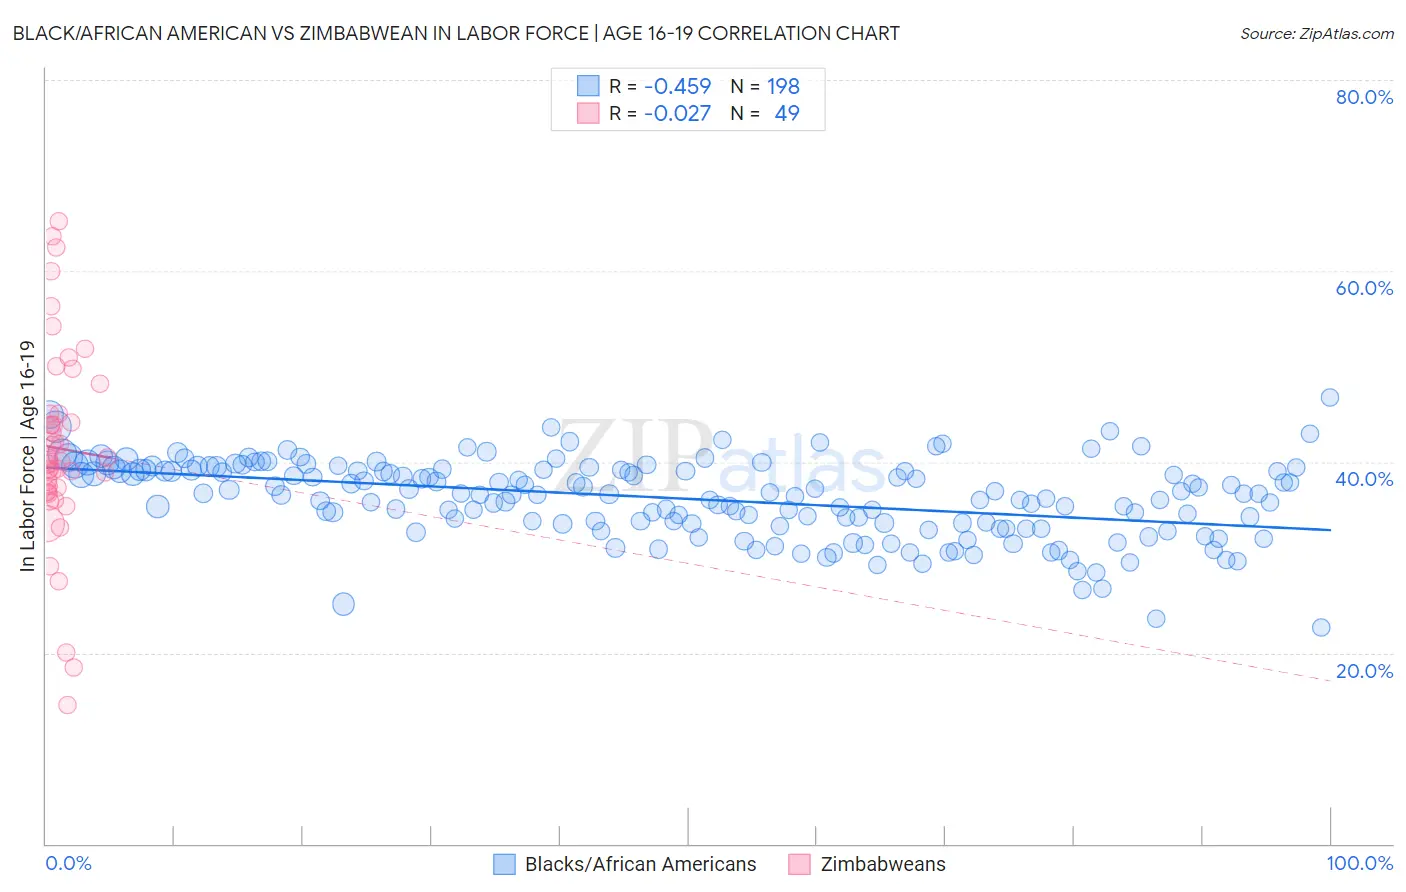
Black/African American vs Zimbabwean In Labor Force | Age 16-19 Correlation Chart
The statistical analysis conducted on geographies consisting of 562,399,773 people shows a moderate negative correlation between the proportion of Blacks/African Americans and labor force participation rate among population between the ages 16 and 19 in the United States with a correlation coefficient (R) of -0.459 and weighted average of 36.5%. Similarly, the statistical analysis conducted on geographies consisting of 69,203,596 people shows no correlation between the proportion of Zimbabweans and labor force participation rate among population between the ages 16 and 19 in the United States with a correlation coefficient (R) of -0.027 and weighted average of 38.7%, a difference of 6.1%.
In Labor Force | Age 16-19 Correlation Summary
| Measurement | Black/African American | Zimbabwean |
| Minimum | 22.6% | 14.6% |
| Maximum | 46.8% | 65.2% |
| Range | 24.2% | 50.6% |
| Mean | 36.1% | 41.4% |
| Median | 36.6% | 40.1% |
| Interquartile 25% (IQ1) | 33.5% | 36.9% |
| Interquartile 75% (IQ3) | 39.2% | 45.1% |
| Interquartile Range (IQR) | 5.7% | 8.2% |
| Standard Deviation (Sample) | 4.1% | 10.3% |
| Standard Deviation (Population) | 4.1% | 10.2% |
Similar Demographics by In Labor Force | Age 16-19
Demographics Similar to Blacks/African Americans by In Labor Force | Age 16-19
In terms of in labor force | age 16-19, the demographic groups most similar to Blacks/African Americans are Immigrants from Northern Europe (36.5%, a difference of 0.080%), Immigrants from Southern Europe (36.4%, a difference of 0.090%), Albanian (36.5%, a difference of 0.19%), Native/Alaskan (36.6%, a difference of 0.20%), and Immigrants from Morocco (36.4%, a difference of 0.21%).
| Demographics | Rating | Rank | In Labor Force | Age 16-19 |
| Immigrants | Cambodia | 58.4 /100 | #171 | Average 36.7% |
| South Africans | 58.3 /100 | #172 | Average 36.7% |
| Russians | 57.5 /100 | #173 | Average 36.7% |
| Immigrants | Czechoslovakia | 50.0 /100 | #174 | Average 36.6% |
| Natives/Alaskans | 49.0 /100 | #175 | Average 36.6% |
| Albanians | 48.8 /100 | #176 | Average 36.5% |
| Immigrants | Northern Europe | 46.6 /100 | #177 | Average 36.5% |
| Blacks/African Americans | 45.1 /100 | #178 | Average 36.5% |
| Immigrants | Southern Europe | 43.3 /100 | #179 | Average 36.4% |
| Immigrants | Morocco | 41.1 /100 | #180 | Average 36.4% |
| Jordanians | 39.6 /100 | #181 | Fair 36.4% |
| Immigrants | Italy | 39.1 /100 | #182 | Fair 36.4% |
| Eastern Europeans | 38.8 /100 | #183 | Fair 36.4% |
| Costa Ricans | 36.1 /100 | #184 | Fair 36.3% |
| Bhutanese | 35.3 /100 | #185 | Fair 36.3% |
Demographics Similar to Zimbabweans by In Labor Force | Age 16-19
In terms of in labor force | age 16-19, the demographic groups most similar to Zimbabweans are Hmong (38.7%, a difference of 0.010%), Immigrants from Cameroon (38.7%, a difference of 0.030%), Immigrants from Thailand (38.7%, a difference of 0.070%), Immigrants from Eritrea (38.7%, a difference of 0.090%), and Iraqi (38.6%, a difference of 0.25%).
| Demographics | Rating | Rank | In Labor Force | Age 16-19 |
| Immigrants | North America | 99.4 /100 | #95 | Exceptional 38.9% |
| Latvians | 99.4 /100 | #96 | Exceptional 38.9% |
| Greeks | 99.3 /100 | #97 | Exceptional 38.9% |
| Ugandans | 99.3 /100 | #98 | Exceptional 38.9% |
| Immigrants | North Macedonia | 99.3 /100 | #99 | Exceptional 38.9% |
| Immigrants | Thailand | 99.1 /100 | #100 | Exceptional 38.7% |
| Hmong | 99.1 /100 | #101 | Exceptional 38.7% |
| Zimbabweans | 99.1 /100 | #102 | Exceptional 38.7% |
| Immigrants | Cameroon | 99.0 /100 | #103 | Exceptional 38.7% |
| Immigrants | Eritrea | 99.0 /100 | #104 | Exceptional 38.7% |
| Iraqis | 98.9 /100 | #105 | Exceptional 38.6% |
| Delaware | 98.8 /100 | #106 | Exceptional 38.6% |
| Chinese | 98.8 /100 | #107 | Exceptional 38.6% |
| Immigrants | Ethiopia | 98.7 /100 | #108 | Exceptional 38.6% |
| Lebanese | 98.7 /100 | #109 | Exceptional 38.6% |