Immigrants from Afghanistan vs Somali Householder Income Over 65 years

COMPARE

Immigrants from Afghanistan
Race
Ancestry
AfghanAfricanAlaska NativeAlaskan AthabascanAlbanianAleutAlsatianAmericanApacheArabArapahoArgentineanArmenianAssyrian/Chaldean/SyriacAustralianAustrianBahamianBangladeshiBarbadianBasqueBelgianBelizeanBermudanBhutaneseBlackfeetBolivianBrazilianBritishBritish West IndianBulgarianBurmeseCajunCambodianCanadianCape VerdeanCarpatho RusynCelticCentral AmericanCentral American IndianCherokeeCheyenneChickasawChileanChineseChippewaChoctawColombianColvilleComancheCosta RicanCreeCreekCroatianCrowCubanCypriotCzechCzechoslovakianDanishDelawareDominicanDutchDutch West IndianEastern EuropeanEcuadorianEgyptianEnglishEstonianEthiopianEuropeanFijianFilipinoFinnishFrenchFrench American IndianFrench CanadianGermanGerman RussianGhanaianGreekGuamanian/ChamorroGuatemalanGuyaneseHaitianHmongHonduranHopiHoumaHungarianIcelanderIndian (Asian)IndonesianInupiatIranianIraqiIrishIroquoisIsraeliItalianJamaicanJapaneseJordanianKenyanKiowaKoreanLaotianLatvianLebaneseLiberianLithuanianLumbeeLuxembourgerMacedonianMalaysianMalteseMarshalleseMenomineeMexicanMexican American IndianMongolianMoroccanNative HawaiianNavajoNepaleseNew ZealanderNicaraguanNigerianNorthern EuropeanNorwegianOkinawanOsageOttawaPaiutePakistaniPalestinianPanamanianParaguayanPennsylvania GermanPeruvianPimaPolishPortuguesePotawatomiPuebloPuerto RicanPuget Sound SalishRomanianRussianSalvadoranSamoanScandinavianScotch-IrishScottishSeminoleSenegaleseSerbianShoshoneSierra LeoneanSiouxSlavicSlovakSloveneSouth AfricanSouth AmericanSouth American IndianSoviet UnionSpaniardSpanishSpanish AmericanSpanish American IndianSri LankanSubsaharan AfricanSudaneseSwedishSwissSyrianTaiwaneseThaiTlingit-HaidaTohono O'OdhamTonganTrinidadian and TobagonianTsimshianTurkishU.S. Virgin IslanderUgandanUkrainianUruguayanUteVenezuelanVietnameseWelshWest IndianYakamaYaquiYugoslavianYumanYup'ikZimbabwean
Immigration
NonimmigrantsImmigrantsAfghanistanAfricaAlbaniaArgentinaArmeniaAsiaAustraliaAustriaBahamasBangladeshBarbadosBelarusBelgiumBelizeBoliviaBosnia and HerzegovinaBrazilBulgariaBurma/MyanmarCabo VerdeCambodiaCameroonCanadaCaribbeanCentral AmericaChileChinaColombiaCongoCosta RicaCroatiaCubaCzechoslovakiaDenmarkDominicaDominican RepublicEastern AfricaEastern AsiaEastern EuropeEcuadorEgyptEl SalvadorEnglandEritreaEthiopiaEuropeFijiFranceGermanyGhanaGreeceGrenadaGuatemalaGuyanaHaitiHondurasHong KongHungaryIndiaIndonesiaIranIraqIrelandIsraelItalyJamaicaJapanJordanKazakhstanKenyaKoreaKuwaitLaosLatin AmericaLatviaLebanonLiberiaLithuaniaMalaysiaMexicoMicronesiaMiddle AfricaMoldovaMoroccoNepalNetherlandsNicaraguaNigeriaNorth AmericaNorth MacedoniaNorthern AfricaNorthern EuropeNorwayOceaniaPakistanPanamaPeruPhilippinesPolandPortugalRomaniaRussiaSaudi ArabiaScotlandSenegalSerbiaSierra LeoneSingaporeSomaliaSouth AfricaSouth AmericaSouth Central AsiaSouth Eastern AsiaSouthern EuropeSpainSri LankaSt. Vincent and the GrenadinesSudanSwedenSwitzerlandSyriaTaiwanThailandTrinidad and TobagoTurkeyUgandaUkraineUruguayUzbekistanVenezuelaVietnamWest IndiesWestern AfricaWestern AsiaWestern EuropeYemenZaireZimbabweAzores
Somali
Race
Ancestry
AfghanAfricanAlaska NativeAlaskan AthabascanAlbanianAleutAlsatianAmericanApacheArabArapahoArgentineanArmenianAssyrian/Chaldean/SyriacAustralianAustrianBahamianBangladeshiBarbadianBasqueBelgianBelizeanBermudanBhutaneseBlackfeetBolivianBrazilianBritishBritish West IndianBulgarianBurmeseCajunCambodianCanadianCape VerdeanCarpatho RusynCelticCentral AmericanCentral American IndianCherokeeCheyenneChickasawChileanChineseChippewaChoctawColombianColvilleComancheCosta RicanCreeCreekCroatianCrowCubanCypriotCzechCzechoslovakianDanishDelawareDominicanDutchDutch West IndianEastern EuropeanEcuadorianEgyptianEnglishEstonianEthiopianEuropeanFijianFilipinoFinnishFrenchFrench American IndianFrench CanadianGermanGerman RussianGhanaianGreekGuamanian/ChamorroGuatemalanGuyaneseHaitianHmongHonduranHopiHoumaHungarianIcelanderIndian (Asian)IndonesianInupiatIranianIraqiIrishIroquoisIsraeliItalianJamaicanJapaneseJordanianKenyanKiowaKoreanLaotianLatvianLebaneseLiberianLithuanianLumbeeLuxembourgerMacedonianMalaysianMalteseMarshalleseMenomineeMexicanMexican American IndianMongolianMoroccanNative HawaiianNavajoNepaleseNew ZealanderNicaraguanNigerianNorthern EuropeanNorwegianOkinawanOsageOttawaPaiutePakistaniPalestinianPanamanianParaguayanPennsylvania GermanPeruvianPimaPolishPortuguesePotawatomiPuebloPuerto RicanPuget Sound SalishRomanianRussianSalvadoranSamoanScandinavianScotch-IrishScottishSeminoleSenegaleseSerbianShoshoneSierra LeoneanSiouxSlavicSlovakSloveneSomaliSouth AfricanSouth AmericanSouth American IndianSoviet UnionSpaniardSpanishSpanish AmericanSpanish American IndianSri LankanSubsaharan AfricanSudaneseSwedishSwissSyrianTaiwaneseThaiTlingit-HaidaTohono O'OdhamTonganTrinidadian and TobagonianTsimshianTurkishU.S. Virgin IslanderUgandanUkrainianUruguayanUteVenezuelanVietnameseWelshWest IndianYakamaYaquiYugoslavianYumanYup'ikZimbabwean
Immigration
NonimmigrantsImmigrantsAfricaAlbaniaArgentinaArmeniaAsiaAustraliaAustriaBahamasBangladeshBarbadosBelarusBelgiumBelizeBoliviaBosnia and HerzegovinaBrazilBulgariaBurma/MyanmarCabo VerdeCambodiaCameroonCanadaCaribbeanCentral AmericaChileChinaColombiaCongoCosta RicaCroatiaCubaCzechoslovakiaDenmarkDominicaDominican RepublicEastern AfricaEastern AsiaEastern EuropeEcuadorEgyptEl SalvadorEnglandEritreaEthiopiaEuropeFijiFranceGermanyGhanaGreeceGrenadaGuatemalaGuyanaHaitiHondurasHong KongHungaryIndiaIndonesiaIranIraqIrelandIsraelItalyJamaicaJapanJordanKazakhstanKenyaKoreaKuwaitLaosLatin AmericaLatviaLebanonLiberiaLithuaniaMalaysiaMexicoMicronesiaMiddle AfricaMoldovaMoroccoNepalNetherlandsNicaraguaNigeriaNorth AmericaNorth MacedoniaNorthern AfricaNorthern EuropeNorwayOceaniaPakistanPanamaPeruPhilippinesPolandPortugalRomaniaRussiaSaudi ArabiaScotlandSenegalSerbiaSierra LeoneSingaporeSomaliaSouth AfricaSouth AmericaSouth Central AsiaSouth Eastern AsiaSouthern EuropeSpainSri LankaSt. Vincent and the GrenadinesSudanSwedenSwitzerlandSyriaTaiwanThailandTrinidad and TobagoTurkeyUgandaUkraineUruguayUzbekistanVenezuelaVietnamWest IndiesWestern AfricaWestern AsiaWestern EuropeYemenZaireZimbabweAzores
Householder Income Over 65 years
Income
Poverty
Unemployment
Labor Participation
Family Structure
Vehicle Availability
Education Level
Disability

Householder Income Over 65 years Comparison

Immigrants from Afghanistan

Somalis

Exceptional
Tragic
$67,007
HOUSEHOLDER INCOME OVER 65 YEARS
99.8/ 100
METRIC RATING
45th/ 347
METRIC RANK
$54,004
HOUSEHOLDER INCOME OVER 65 YEARS
0.1/ 100
METRIC RATING
281st/ 347
METRIC RANK

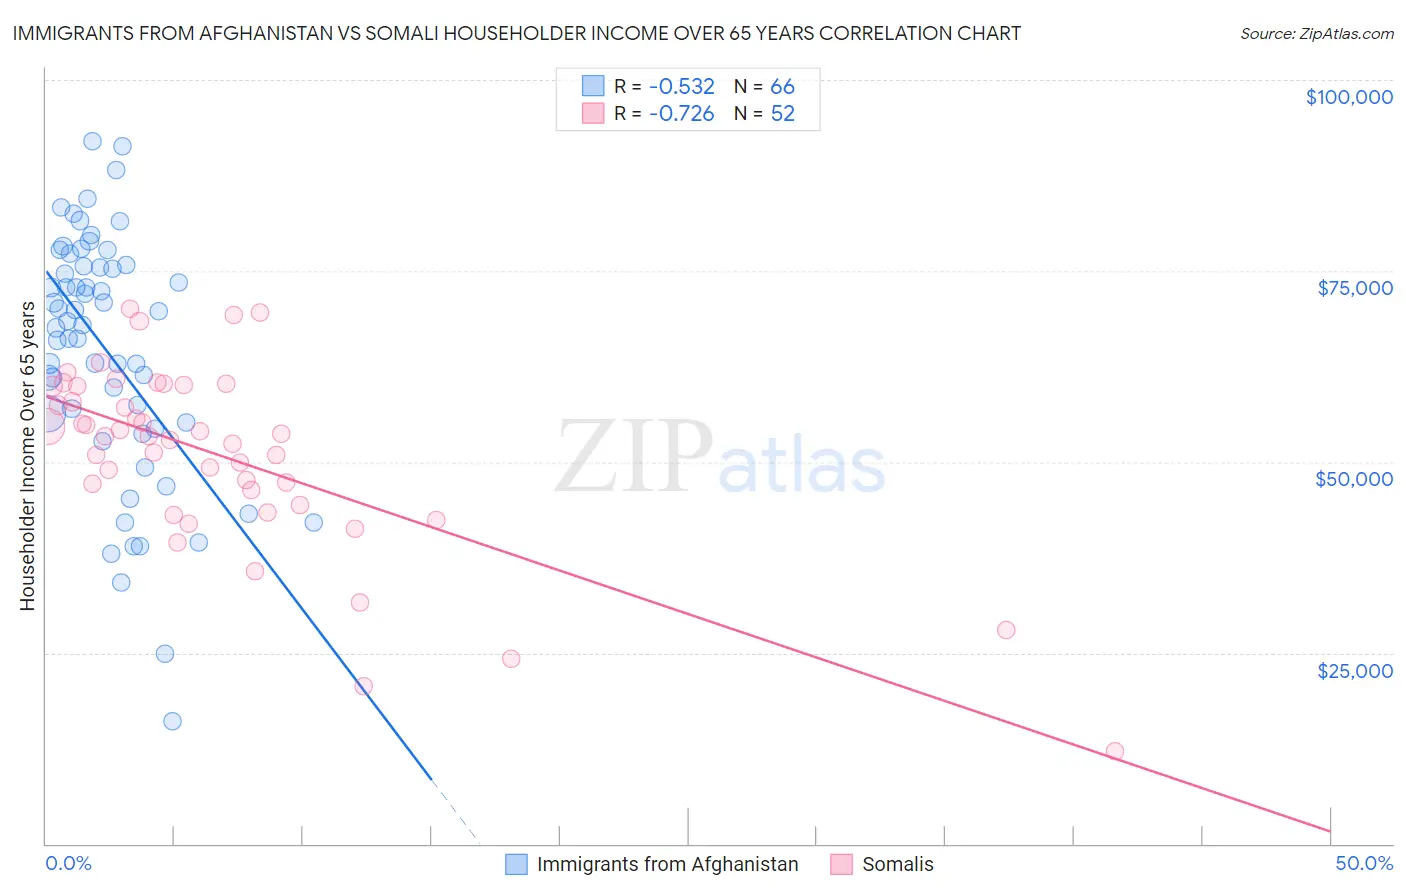
Immigrants from Afghanistan vs Somali Householder Income Over 65 years Correlation Chart

The statistical analysis conducted on geographies consisting of 147,467,112 people shows a substantial negative correlation between the proportion of Immigrants from Afghanistan and household income with householder over the age of 65 in the United States with a correlation coefficient (R) of -0.532 and weighted average of $67,007. Similarly, the statistical analysis conducted on geographies consisting of 99,125,363 people shows a strong negative correlation between the proportion of Somalis and household income with householder over the age of 65 in the United States with a correlation coefficient (R) of -0.726 and weighted average of $54,004, a difference of 24.1%.
Immigrants from Afghanistan vs Somali Householder Income Over 65 years

Householder Income Over 65 years Correlation Summary

MeasurementImmigrants from AfghanistanSomali
Minimum$16,042$12,049
Maximum$92,051$69,985
Range$76,009$57,936
Mean$64,426$50,826
Median$68,184$53,340
Interquartile 25% (IQ1)$55,130$45,352
Interquartile 75% (IQ3)$75,556$59,867
Interquartile Range (IQR)$20,426$14,515
Standard Deviation (Sample)$16,099$12,083
Standard Deviation (Population)$15,977$11,967

Similar Demographics by Householder Income Over 65 years

Demographics Similar to Immigrants from Afghanistan by Householder Income Over 65 years

In terms of householder income over 65 years, the demographic groups most similar to Immigrants from Afghanistan are Cambodian ($66,892, a difference of 0.17%), Australian ($66,891, a difference of 0.17%), Immigrants from France ($66,826, a difference of 0.27%), Immigrants from South Africa ($67,234, a difference of 0.34%), and Immigrants from Indonesia ($66,694, a difference of 0.47%).
DemographicsRating | RankHouseholder Income Over 65 years
Estonians
99.9
/100
|
#38
Exceptional
$67,926
Russians
99.9
/100
|
#39
Exceptional
$67,626
Immigrants | Asia
99.9
/100
|
#40
Exceptional
$67,594
Koreans
99.9
/100
|
#41
Exceptional
$67,472
New Zealanders
99.9
/100
|
#42
Exceptional
$67,333
Latvians
99.9
/100
|
#43
Exceptional
$67,326
Immigrants | South Africa
99.9
/100
|
#44
Exceptional
$67,234
Immigrants | Afghanistan
99.8
/100
|
#45
Exceptional
$67,007
Cambodians
99.8
/100
|
#46
Exceptional
$66,892
Australians
99.8
/100
|
#47
Exceptional
$66,891
Immigrants | France
99.8
/100
|
#48
Exceptional
$66,826
Immigrants | Indonesia
99.8
/100
|
#49
Exceptional
$66,694
Immigrants | Turkey
99.7
/100
|
#50
Exceptional
$66,672
Israelis
99.7
/100
|
#51
Exceptional
$66,636
Immigrants | Scotland
99.7
/100
|
#52
Exceptional
$66,620

Demographics Similar to Somalis by Householder Income Over 65 years

In terms of householder income over 65 years, the demographic groups most similar to Somalis are Immigrants from Jamaica ($54,027, a difference of 0.040%), Immigrants from Ecuador ($54,030, a difference of 0.050%), Blackfeet ($54,029, a difference of 0.050%), Immigrants from Armenia ($53,974, a difference of 0.060%), and Immigrants from Liberia ($53,967, a difference of 0.070%).
DemographicsRating | RankHouseholder Income Over 65 years
Barbadians
0.1
/100
|
#274
Tragic
$54,163
Cherokee
0.1
/100
|
#275
Tragic
$54,133
Cree
0.1
/100
|
#276
Tragic
$54,129
Cheyenne
0.1
/100
|
#277
Tragic
$54,096
Immigrants | Ecuador
0.1
/100
|
#278
Tragic
$54,030
Blackfeet
0.1
/100
|
#279
Tragic
$54,029
Immigrants | Jamaica
0.1
/100
|
#280
Tragic
$54,027
Somalis
0.1
/100
|
#281
Tragic
$54,004
Immigrants | Armenia
0.1
/100
|
#282
Tragic
$53,974
Immigrants | Liberia
0.1
/100
|
#283
Tragic
$53,967
Immigrants | Guatemala
0.1
/100
|
#284
Tragic
$53,950
Mexicans
0.1
/100
|
#285
Tragic
$53,897
Chippewa
0.1
/100
|
#286
Tragic
$53,847
Immigrants | Barbados
0.1
/100
|
#287
Tragic
$53,766
Paiute
0.1
/100
|
#288
Tragic
$53,762