Scotch-Irish vs Somali Householder Income Over 65 years
COMPARE
Scotch-Irish
Somali
Householder Income Over 65 years
Householder Income Over 65 years Comparison
Scotch-Irish
Somalis
$59,447
HOUSEHOLDER INCOME OVER 65 YEARS
16.9/ 100
METRIC RATING
203rd/ 347
METRIC RANK
$54,004
HOUSEHOLDER INCOME OVER 65 YEARS
0.1/ 100
METRIC RATING
281st/ 347
METRIC RANK
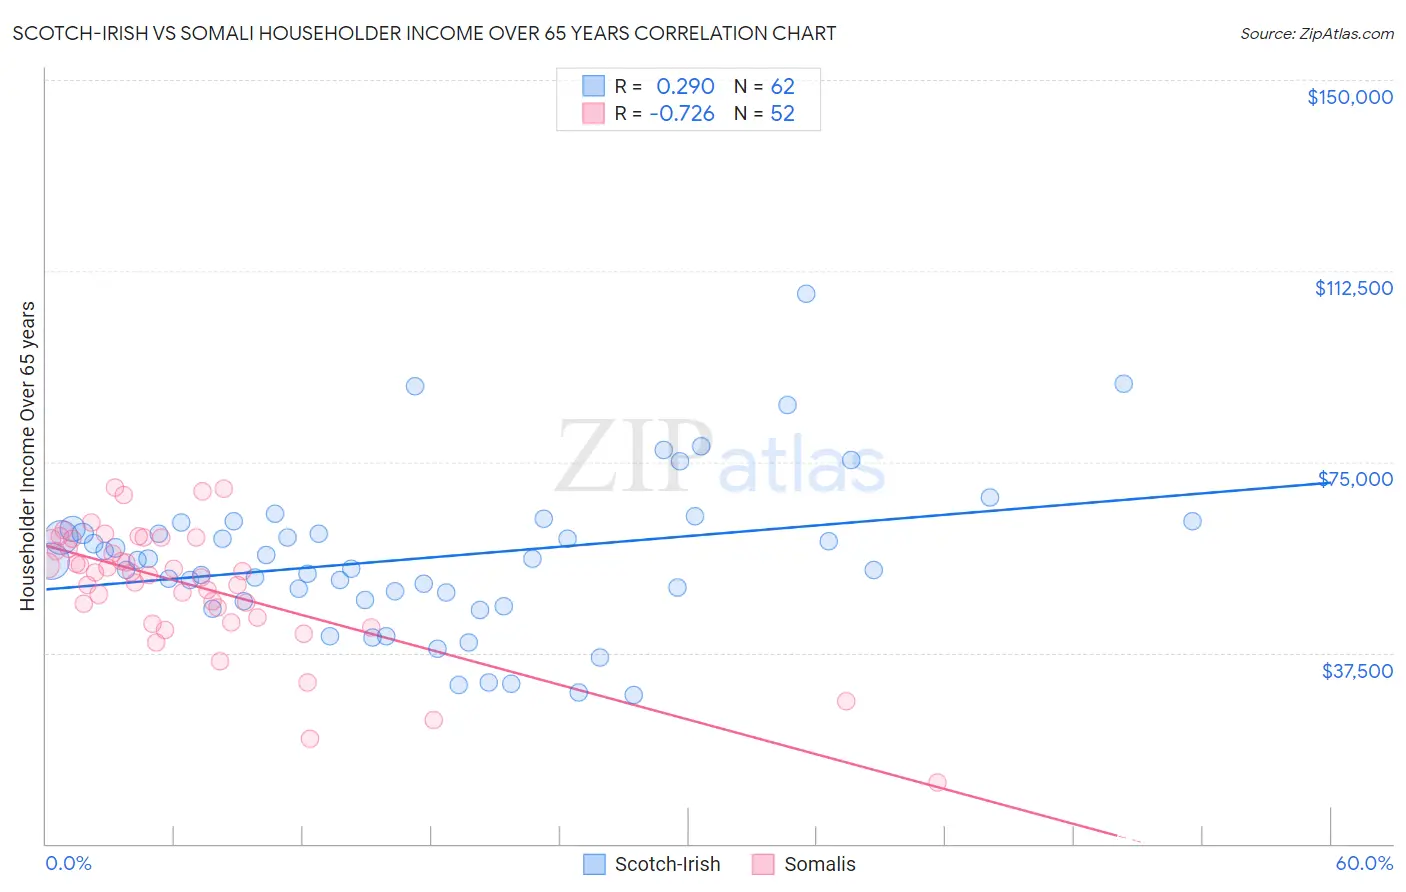
Scotch-Irish vs Somali Householder Income Over 65 years Correlation Chart
The statistical analysis conducted on geographies consisting of 544,677,827 people shows a weak positive correlation between the proportion of Scotch-Irish and household income with householder over the age of 65 in the United States with a correlation coefficient (R) of 0.290 and weighted average of $59,447. Similarly, the statistical analysis conducted on geographies consisting of 99,125,363 people shows a strong negative correlation between the proportion of Somalis and household income with householder over the age of 65 in the United States with a correlation coefficient (R) of -0.726 and weighted average of $54,004, a difference of 10.1%.
Householder Income Over 65 years Correlation Summary
| Measurement | Scotch-Irish | Somali |
| Minimum | $29,123 | $12,049 |
| Maximum | $108,125 | $69,985 |
| Range | $79,002 | $57,936 |
| Mean | $56,120 | $50,826 |
| Median | $55,574 | $53,340 |
| Interquartile 25% (IQ1) | $47,845 | $45,352 |
| Interquartile 75% (IQ3) | $61,936 | $59,867 |
| Interquartile Range (IQR) | $14,091 | $14,515 |
| Standard Deviation (Sample) | $15,113 | $12,083 |
| Standard Deviation (Population) | $14,991 | $11,967 |
Similar Demographics by Householder Income Over 65 years
Demographics Similar to Scotch-Irish by Householder Income Over 65 years
In terms of householder income over 65 years, the demographic groups most similar to Scotch-Irish are Arapaho ($59,383, a difference of 0.11%), Dutch ($59,539, a difference of 0.15%), Finnish ($59,535, a difference of 0.15%), Immigrants from Sudan ($59,248, a difference of 0.34%), and Immigrants ($59,656, a difference of 0.35%).
| Demographics | Rating | Rank | Householder Income Over 65 years |
| Germans | 21.5 /100 | #196 | Fair $59,730 |
| Immigrants | Kenya | 21.1 /100 | #197 | Fair $59,710 |
| Moroccans | 20.7 /100 | #198 | Fair $59,683 |
| Immigrants | Immigrants | 20.2 /100 | #199 | Fair $59,656 |
| French | 20.2 /100 | #200 | Fair $59,656 |
| Dutch | 18.3 /100 | #201 | Poor $59,539 |
| Finns | 18.2 /100 | #202 | Poor $59,535 |
| Scotch-Irish | 16.9 /100 | #203 | Poor $59,447 |
| Arapaho | 16.0 /100 | #204 | Poor $59,383 |
| Immigrants | Sudan | 14.2 /100 | #205 | Poor $59,248 |
| Immigrants | South America | 13.0 /100 | #206 | Poor $59,151 |
| Salvadorans | 12.9 /100 | #207 | Poor $59,141 |
| Uruguayans | 12.3 /100 | #208 | Poor $59,090 |
| Slovaks | 11.7 /100 | #209 | Poor $59,039 |
| Nigerians | 11.2 /100 | #210 | Poor $58,992 |
Demographics Similar to Somalis by Householder Income Over 65 years
In terms of householder income over 65 years, the demographic groups most similar to Somalis are Immigrants from Jamaica ($54,027, a difference of 0.040%), Immigrants from Ecuador ($54,030, a difference of 0.050%), Blackfeet ($54,029, a difference of 0.050%), Immigrants from Armenia ($53,974, a difference of 0.060%), and Immigrants from Liberia ($53,967, a difference of 0.070%).
| Demographics | Rating | Rank | Householder Income Over 65 years |
| Barbadians | 0.1 /100 | #274 | Tragic $54,163 |
| Cherokee | 0.1 /100 | #275 | Tragic $54,133 |
| Cree | 0.1 /100 | #276 | Tragic $54,129 |
| Cheyenne | 0.1 /100 | #277 | Tragic $54,096 |
| Immigrants | Ecuador | 0.1 /100 | #278 | Tragic $54,030 |
| Blackfeet | 0.1 /100 | #279 | Tragic $54,029 |
| Immigrants | Jamaica | 0.1 /100 | #280 | Tragic $54,027 |
| Somalis | 0.1 /100 | #281 | Tragic $54,004 |
| Immigrants | Armenia | 0.1 /100 | #282 | Tragic $53,974 |
| Immigrants | Liberia | 0.1 /100 | #283 | Tragic $53,967 |
| Immigrants | Guatemala | 0.1 /100 | #284 | Tragic $53,950 |
| Mexicans | 0.1 /100 | #285 | Tragic $53,897 |
| Chippewa | 0.1 /100 | #286 | Tragic $53,847 |
| Immigrants | Barbados | 0.1 /100 | #287 | Tragic $53,766 |
| Paiute | 0.1 /100 | #288 | Tragic $53,762 |