Immigrants from Northern Europe vs Paraguayan Householder Income Over 65 years
COMPARE
Immigrants from Northern Europe
Paraguayan
Householder Income Over 65 years
Householder Income Over 65 years Comparison
Immigrants from Northern Europe
Paraguayans
$69,003
HOUSEHOLDER INCOME OVER 65 YEARS
100.0/ 100
METRIC RATING
30th/ 347
METRIC RANK
$64,443
HOUSEHOLDER INCOME OVER 65 YEARS
97.4/ 100
METRIC RATING
89th/ 347
METRIC RANK
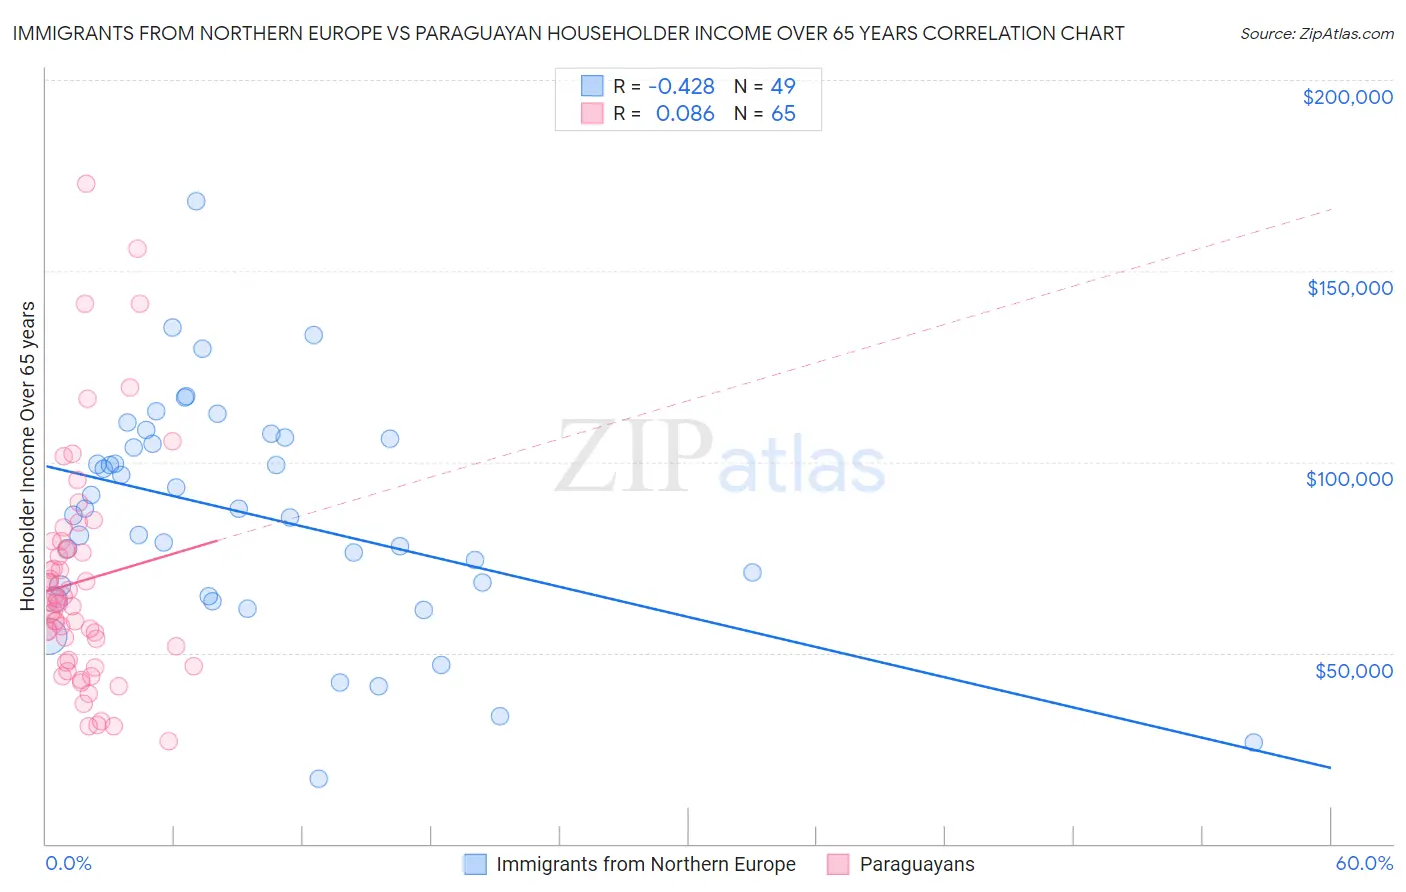
Immigrants from Northern Europe vs Paraguayan Householder Income Over 65 years Correlation Chart
The statistical analysis conducted on geographies consisting of 475,347,578 people shows a moderate negative correlation between the proportion of Immigrants from Northern Europe and household income with householder over the age of 65 in the United States with a correlation coefficient (R) of -0.428 and weighted average of $69,003. Similarly, the statistical analysis conducted on geographies consisting of 95,003,306 people shows a slight positive correlation between the proportion of Paraguayans and household income with householder over the age of 65 in the United States with a correlation coefficient (R) of 0.086 and weighted average of $64,443, a difference of 7.1%.
Householder Income Over 65 years Correlation Summary
| Measurement | Immigrants from Northern Europe | Paraguayan |
| Minimum | $16,875 | $26,765 |
| Maximum | $168,214 | $172,969 |
| Range | $151,339 | $146,204 |
| Mean | $86,244 | $68,770 |
| Median | $87,597 | $63,287 |
| Interquartile 25% (IQ1) | $66,142 | $47,789 |
| Interquartile 75% (IQ3) | $106,144 | $78,220 |
| Interquartile Range (IQR) | $40,003 | $30,430 |
| Standard Deviation (Sample) | $29,698 | $29,858 |
| Standard Deviation (Population) | $29,393 | $29,627 |
Similar Demographics by Householder Income Over 65 years
Demographics Similar to Immigrants from Northern Europe by Householder Income Over 65 years
In terms of householder income over 65 years, the demographic groups most similar to Immigrants from Northern Europe are Afghan ($68,951, a difference of 0.070%), Immigrants from Australia ($69,164, a difference of 0.23%), Immigrants from China ($69,174, a difference of 0.25%), Asian ($68,822, a difference of 0.26%), and Immigrants from Denmark ($68,801, a difference of 0.29%).
| Demographics | Rating | Rank | Householder Income Over 65 years |
| Immigrants | Japan | 100.0 /100 | #23 | Exceptional $69,774 |
| Immigrants | Sweden | 100.0 /100 | #24 | Exceptional $69,722 |
| Immigrants | Belgium | 100.0 /100 | #25 | Exceptional $69,703 |
| Immigrants | Sri Lanka | 100.0 /100 | #26 | Exceptional $69,426 |
| Immigrants | Switzerland | 100.0 /100 | #27 | Exceptional $69,343 |
| Immigrants | China | 100.0 /100 | #28 | Exceptional $69,174 |
| Immigrants | Australia | 100.0 /100 | #29 | Exceptional $69,164 |
| Immigrants | Northern Europe | 100.0 /100 | #30 | Exceptional $69,003 |
| Afghans | 100.0 /100 | #31 | Exceptional $68,951 |
| Asians | 100.0 /100 | #32 | Exceptional $68,822 |
| Immigrants | Denmark | 100.0 /100 | #33 | Exceptional $68,801 |
| Immigrants | Ireland | 100.0 /100 | #34 | Exceptional $68,495 |
| Tongans | 100.0 /100 | #35 | Exceptional $68,235 |
| Immigrants | Austria | 99.9 /100 | #36 | Exceptional $68,208 |
| Turks | 99.9 /100 | #37 | Exceptional $68,037 |
Demographics Similar to Paraguayans by Householder Income Over 65 years
In terms of householder income over 65 years, the demographic groups most similar to Paraguayans are Immigrants from Kuwait ($64,433, a difference of 0.020%), Immigrants from Romania ($64,462, a difference of 0.030%), Austrian ($64,470, a difference of 0.040%), Immigrants from Oceania ($64,416, a difference of 0.040%), and Immigrants from Bulgaria ($64,379, a difference of 0.10%).
| Demographics | Rating | Rank | Householder Income Over 65 years |
| Immigrants | Fiji | 98.2 /100 | #82 | Exceptional $64,795 |
| Northern Europeans | 97.9 /100 | #83 | Exceptional $64,658 |
| Immigrants | Greece | 97.9 /100 | #84 | Exceptional $64,636 |
| Immigrants | Lebanon | 97.6 /100 | #85 | Exceptional $64,521 |
| Immigrants | Russia | 97.6 /100 | #86 | Exceptional $64,512 |
| Austrians | 97.5 /100 | #87 | Exceptional $64,470 |
| Immigrants | Romania | 97.5 /100 | #88 | Exceptional $64,462 |
| Paraguayans | 97.4 /100 | #89 | Exceptional $64,443 |
| Immigrants | Kuwait | 97.4 /100 | #90 | Exceptional $64,433 |
| Immigrants | Oceania | 97.4 /100 | #91 | Exceptional $64,416 |
| Immigrants | Bulgaria | 97.3 /100 | #92 | Exceptional $64,379 |
| Jordanians | 97.1 /100 | #93 | Exceptional $64,313 |
| Immigrants | Egypt | 97.0 /100 | #94 | Exceptional $64,299 |
| Immigrants | Latvia | 97.0 /100 | #95 | Exceptional $64,298 |
| Immigrants | Hungary | 97.0 /100 | #96 | Exceptional $64,277 |