Samoan vs Paraguayan Householder Income Over 65 years
COMPARE
Samoan
Paraguayan
Householder Income Over 65 years
Householder Income Over 65 years Comparison
Samoans
Paraguayans
$65,427
HOUSEHOLDER INCOME OVER 65 YEARS
99.1/ 100
METRIC RATING
69th/ 347
METRIC RANK
$64,443
HOUSEHOLDER INCOME OVER 65 YEARS
97.4/ 100
METRIC RATING
89th/ 347
METRIC RANK
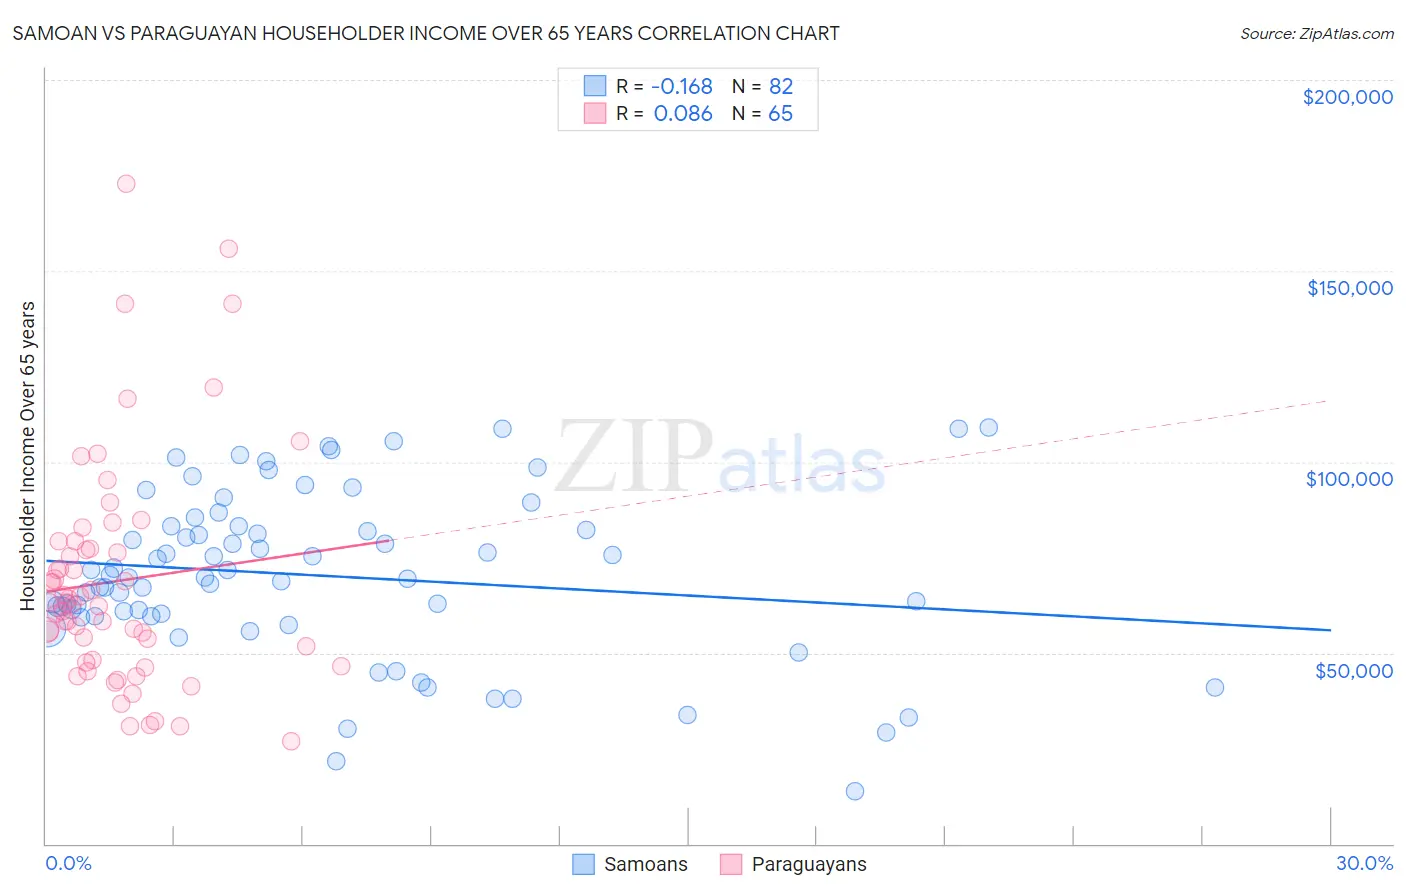
Samoan vs Paraguayan Householder Income Over 65 years Correlation Chart
The statistical analysis conducted on geographies consisting of 224,404,839 people shows a poor negative correlation between the proportion of Samoans and household income with householder over the age of 65 in the United States with a correlation coefficient (R) of -0.168 and weighted average of $65,427. Similarly, the statistical analysis conducted on geographies consisting of 95,003,306 people shows a slight positive correlation between the proportion of Paraguayans and household income with householder over the age of 65 in the United States with a correlation coefficient (R) of 0.086 and weighted average of $64,443, a difference of 1.5%.
Householder Income Over 65 years Correlation Summary
| Measurement | Samoan | Paraguayan |
| Minimum | $13,651 | $26,765 |
| Maximum | $108,977 | $172,969 |
| Range | $95,326 | $146,204 |
| Mean | $70,206 | $68,770 |
| Median | $69,618 | $63,287 |
| Interquartile 25% (IQ1) | $59,611 | $47,789 |
| Interquartile 75% (IQ3) | $83,086 | $78,220 |
| Interquartile Range (IQR) | $23,475 | $30,430 |
| Standard Deviation (Sample) | $21,405 | $29,858 |
| Standard Deviation (Population) | $21,274 | $29,627 |
Demographics Similar to Samoans and Paraguayans by Householder Income Over 65 years
In terms of householder income over 65 years, the demographic groups most similar to Samoans are Mongolian ($65,326, a difference of 0.15%), Greek ($65,306, a difference of 0.19%), Argentinean ($65,246, a difference of 0.28%), Immigrants from Ethiopia ($65,238, a difference of 0.29%), and Lithuanian ($65,209, a difference of 0.33%). Similarly, the demographic groups most similar to Paraguayans are Immigrants from Romania ($64,462, a difference of 0.030%), Austrian ($64,470, a difference of 0.040%), Immigrants from Russia ($64,512, a difference of 0.11%), Immigrants from Lebanon ($64,521, a difference of 0.12%), and Immigrants from Greece ($64,636, a difference of 0.30%).
| Demographics | Rating | Rank | Householder Income Over 65 years |
| Samoans | 99.1 /100 | #69 | Exceptional $65,427 |
| Mongolians | 99.0 /100 | #70 | Exceptional $65,326 |
| Greeks | 98.9 /100 | #71 | Exceptional $65,306 |
| Argentineans | 98.9 /100 | #72 | Exceptional $65,246 |
| Immigrants | Ethiopia | 98.9 /100 | #73 | Exceptional $65,238 |
| Lithuanians | 98.8 /100 | #74 | Exceptional $65,209 |
| Sierra Leoneans | 98.6 /100 | #75 | Exceptional $65,038 |
| Ethiopians | 98.5 /100 | #76 | Exceptional $64,989 |
| Immigrants | Canada | 98.5 /100 | #77 | Exceptional $64,952 |
| Immigrants | Western Europe | 98.5 /100 | #78 | Exceptional $64,933 |
| Hawaiians | 98.4 /100 | #79 | Exceptional $64,920 |
| Immigrants | North America | 98.3 /100 | #80 | Exceptional $64,856 |
| Immigrants | Europe | 98.3 /100 | #81 | Exceptional $64,828 |
| Immigrants | Fiji | 98.2 /100 | #82 | Exceptional $64,795 |
| Northern Europeans | 97.9 /100 | #83 | Exceptional $64,658 |
| Immigrants | Greece | 97.9 /100 | #84 | Exceptional $64,636 |
| Immigrants | Lebanon | 97.6 /100 | #85 | Exceptional $64,521 |
| Immigrants | Russia | 97.6 /100 | #86 | Exceptional $64,512 |
| Austrians | 97.5 /100 | #87 | Exceptional $64,470 |
| Immigrants | Romania | 97.5 /100 | #88 | Exceptional $64,462 |
| Paraguayans | 97.4 /100 | #89 | Exceptional $64,443 |