Immigrants from Zaire vs Carpatho Rusyn Householder Income Over 65 years
COMPARE
Immigrants from Zaire
Carpatho Rusyn
Householder Income Over 65 years
Householder Income Over 65 years Comparison
Immigrants from Zaire
Carpatho Rusyns
$54,512
HOUSEHOLDER INCOME OVER 65 YEARS
0.1/ 100
METRIC RATING
268th/ 347
METRIC RANK
$61,093
HOUSEHOLDER INCOME OVER 65 YEARS
53.3/ 100
METRIC RATING
169th/ 347
METRIC RANK
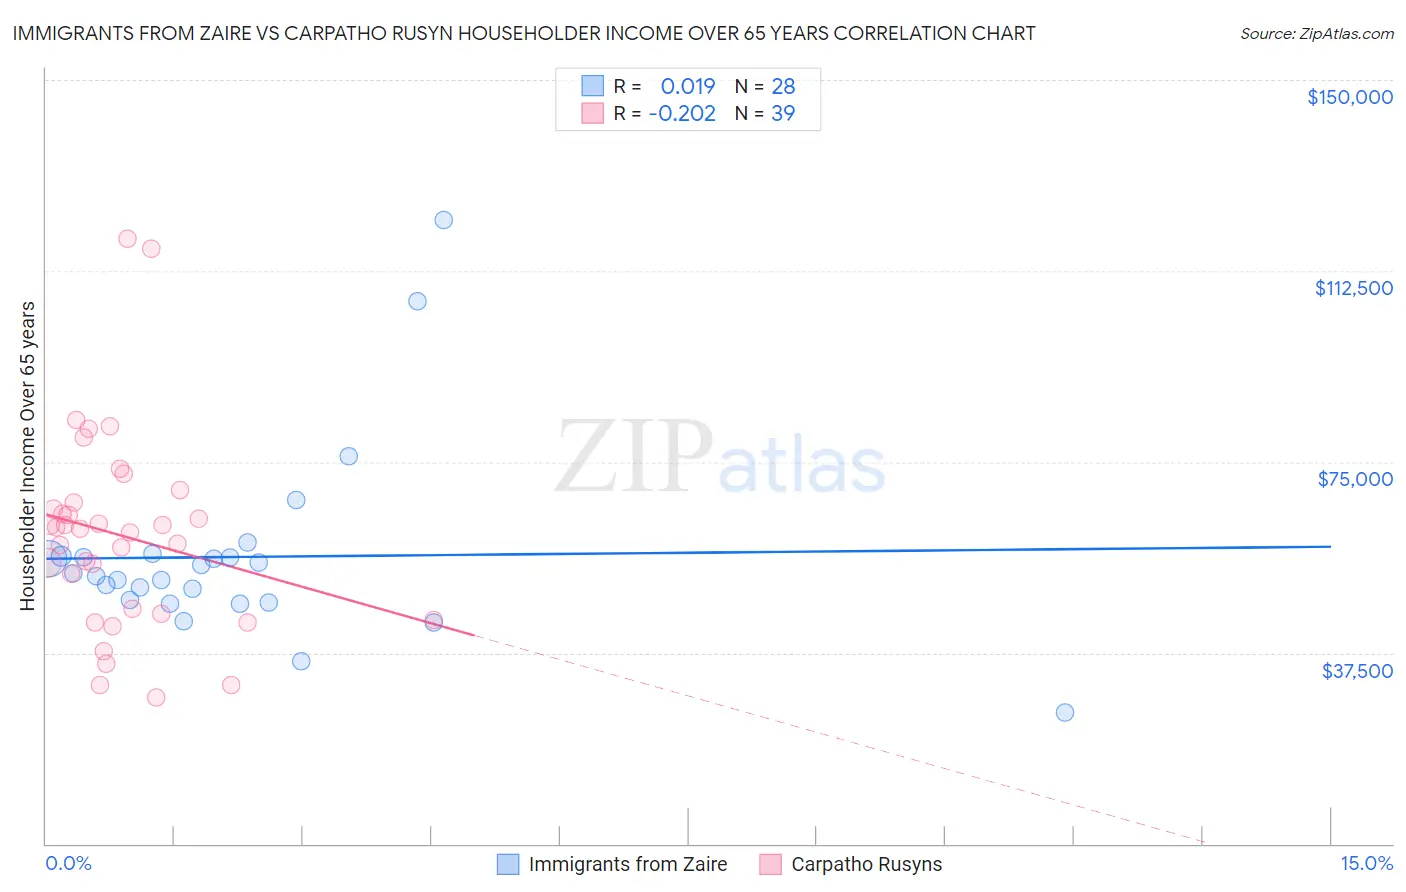
Immigrants from Zaire vs Carpatho Rusyn Householder Income Over 65 years Correlation Chart
The statistical analysis conducted on geographies consisting of 107,158,752 people shows no correlation between the proportion of Immigrants from Zaire and household income with householder over the age of 65 in the United States with a correlation coefficient (R) of 0.019 and weighted average of $54,512. Similarly, the statistical analysis conducted on geographies consisting of 58,852,207 people shows a weak negative correlation between the proportion of Carpatho Rusyns and household income with householder over the age of 65 in the United States with a correlation coefficient (R) of -0.202 and weighted average of $61,093, a difference of 12.1%.
Householder Income Over 65 years Correlation Summary
| Measurement | Immigrants from Zaire | Carpatho Rusyn |
| Minimum | $25,694 | $28,606 |
| Maximum | $122,500 | $118,750 |
| Range | $96,806 | $90,144 |
| Mean | $56,341 | $60,576 |
| Median | $52,820 | $61,884 |
| Interquartile 25% (IQ1) | $47,556 | $45,096 |
| Interquartile 75% (IQ3) | $56,369 | $66,922 |
| Interquartile Range (IQR) | $8,813 | $21,826 |
| Standard Deviation (Sample) | $18,869 | $19,565 |
| Standard Deviation (Population) | $18,529 | $19,313 |
Similar Demographics by Householder Income Over 65 years
Demographics Similar to Immigrants from Zaire by Householder Income Over 65 years
In terms of householder income over 65 years, the demographic groups most similar to Immigrants from Zaire are Guatemalan ($54,526, a difference of 0.030%), Nicaraguan ($54,474, a difference of 0.070%), Jamaican ($54,560, a difference of 0.090%), Immigrants from Senegal ($54,447, a difference of 0.12%), and Belizean ($54,580, a difference of 0.13%).
| Demographics | Rating | Rank | Householder Income Over 65 years |
| Comanche | 0.2 /100 | #261 | Tragic $54,922 |
| Bangladeshis | 0.1 /100 | #262 | Tragic $54,719 |
| French American Indians | 0.1 /100 | #263 | Tragic $54,699 |
| Apache | 0.1 /100 | #264 | Tragic $54,668 |
| Belizeans | 0.1 /100 | #265 | Tragic $54,580 |
| Jamaicans | 0.1 /100 | #266 | Tragic $54,560 |
| Guatemalans | 0.1 /100 | #267 | Tragic $54,526 |
| Immigrants | Zaire | 0.1 /100 | #268 | Tragic $54,512 |
| Nicaraguans | 0.1 /100 | #269 | Tragic $54,474 |
| Immigrants | Senegal | 0.1 /100 | #270 | Tragic $54,447 |
| Liberians | 0.1 /100 | #271 | Tragic $54,356 |
| Potawatomi | 0.1 /100 | #272 | Tragic $54,212 |
| Indonesians | 0.1 /100 | #273 | Tragic $54,176 |
| Barbadians | 0.1 /100 | #274 | Tragic $54,163 |
| Cherokee | 0.1 /100 | #275 | Tragic $54,133 |
Demographics Similar to Carpatho Rusyns by Householder Income Over 65 years
In terms of householder income over 65 years, the demographic groups most similar to Carpatho Rusyns are Irish ($61,097, a difference of 0.010%), Serbian ($61,087, a difference of 0.010%), Norwegian ($61,104, a difference of 0.020%), Inupiat ($61,061, a difference of 0.050%), and Immigrants from Poland ($61,041, a difference of 0.090%).
| Demographics | Rating | Rank | Householder Income Over 65 years |
| Czechs | 57.2 /100 | #162 | Average $61,244 |
| Ugandans | 55.5 /100 | #163 | Average $61,177 |
| Immigrants | North Macedonia | 55.4 /100 | #164 | Average $61,175 |
| Immigrants | Ukraine | 55.1 /100 | #165 | Average $61,163 |
| Immigrants | Eastern Africa | 55.0 /100 | #166 | Average $61,157 |
| Norwegians | 53.6 /100 | #167 | Average $61,104 |
| Irish | 53.4 /100 | #168 | Average $61,097 |
| Carpatho Rusyns | 53.3 /100 | #169 | Average $61,093 |
| Serbians | 53.1 /100 | #170 | Average $61,087 |
| Inupiat | 52.4 /100 | #171 | Average $61,061 |
| Immigrants | Poland | 51.9 /100 | #172 | Average $61,041 |
| Immigrants | Micronesia | 50.8 /100 | #173 | Average $61,000 |
| Luxembourgers | 50.0 /100 | #174 | Average $60,967 |
| Spaniards | 47.3 /100 | #175 | Average $60,866 |
| Spanish | 45.5 /100 | #176 | Average $60,795 |