Czechoslovakian vs Carpatho Rusyn Householder Income Over 65 years
COMPARE
Czechoslovakian
Carpatho Rusyn
Householder Income Over 65 years
Householder Income Over 65 years Comparison
Czechoslovakians
Carpatho Rusyns
$60,581
HOUSEHOLDER INCOME OVER 65 YEARS
40.0/ 100
METRIC RATING
182nd/ 347
METRIC RANK
$61,093
HOUSEHOLDER INCOME OVER 65 YEARS
53.3/ 100
METRIC RATING
169th/ 347
METRIC RANK
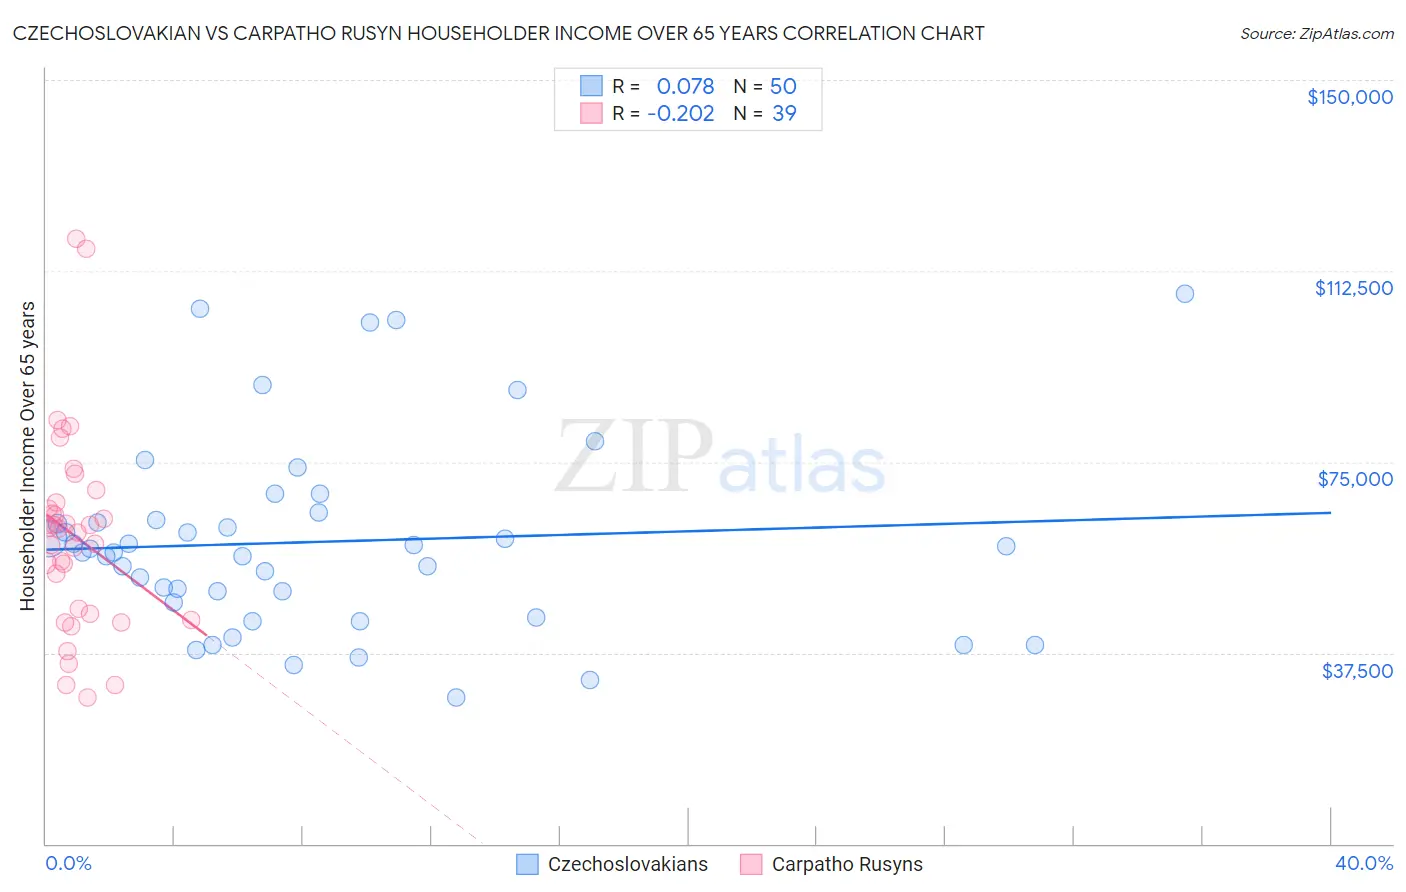
Czechoslovakian vs Carpatho Rusyn Householder Income Over 65 years Correlation Chart
The statistical analysis conducted on geographies consisting of 367,841,442 people shows a slight positive correlation between the proportion of Czechoslovakians and household income with householder over the age of 65 in the United States with a correlation coefficient (R) of 0.078 and weighted average of $60,581. Similarly, the statistical analysis conducted on geographies consisting of 58,852,207 people shows a weak negative correlation between the proportion of Carpatho Rusyns and household income with householder over the age of 65 in the United States with a correlation coefficient (R) of -0.202 and weighted average of $61,093, a difference of 0.85%.
Householder Income Over 65 years Correlation Summary
| Measurement | Czechoslovakian | Carpatho Rusyn |
| Minimum | $28,750 | $28,606 |
| Maximum | $108,125 | $118,750 |
| Range | $79,375 | $90,144 |
| Mean | $59,283 | $60,576 |
| Median | $57,534 | $61,884 |
| Interquartile 25% (IQ1) | $47,364 | $45,096 |
| Interquartile 75% (IQ3) | $63,539 | $66,922 |
| Interquartile Range (IQR) | $16,175 | $21,826 |
| Standard Deviation (Sample) | $18,822 | $19,565 |
| Standard Deviation (Population) | $18,633 | $19,313 |
Demographics Similar to Czechoslovakians and Carpatho Rusyns by Householder Income Over 65 years
In terms of householder income over 65 years, the demographic groups most similar to Czechoslovakians are Celtic ($60,608, a difference of 0.040%), Immigrants from Morocco ($60,647, a difference of 0.11%), Kenyan ($60,514, a difference of 0.11%), Welsh ($60,666, a difference of 0.14%), and Iraqi ($60,466, a difference of 0.19%). Similarly, the demographic groups most similar to Carpatho Rusyns are Irish ($61,097, a difference of 0.010%), Serbian ($61,087, a difference of 0.010%), Norwegian ($61,104, a difference of 0.020%), Inupiat ($61,061, a difference of 0.050%), and Immigrants from Poland ($61,041, a difference of 0.090%).
| Demographics | Rating | Rank | Householder Income Over 65 years |
| Immigrants | Ukraine | 55.1 /100 | #165 | Average $61,163 |
| Immigrants | Eastern Africa | 55.0 /100 | #166 | Average $61,157 |
| Norwegians | 53.6 /100 | #167 | Average $61,104 |
| Irish | 53.4 /100 | #168 | Average $61,097 |
| Carpatho Rusyns | 53.3 /100 | #169 | Average $61,093 |
| Serbians | 53.1 /100 | #170 | Average $61,087 |
| Inupiat | 52.4 /100 | #171 | Average $61,061 |
| Immigrants | Poland | 51.9 /100 | #172 | Average $61,041 |
| Immigrants | Micronesia | 50.8 /100 | #173 | Average $61,000 |
| Luxembourgers | 50.0 /100 | #174 | Average $60,967 |
| Spaniards | 47.3 /100 | #175 | Average $60,866 |
| Spanish | 45.5 /100 | #176 | Average $60,795 |
| Alaska Natives | 44.3 /100 | #177 | Average $60,748 |
| Yup'ik | 43.7 /100 | #178 | Average $60,727 |
| Welsh | 42.2 /100 | #179 | Average $60,666 |
| Immigrants | Morocco | 41.7 /100 | #180 | Average $60,647 |
| Celtics | 40.7 /100 | #181 | Average $60,608 |
| Czechoslovakians | 40.0 /100 | #182 | Average $60,581 |
| Kenyans | 38.4 /100 | #183 | Fair $60,514 |
| Iraqis | 37.2 /100 | #184 | Fair $60,466 |
| Albanians | 32.0 /100 | #185 | Fair $60,249 |