Camas County, ID Map & Demographics
Camas County Overview
$34,790
PER CAPITA INCOME
$79,926
AVG FAMILY INCOME
$63,750
AVG HOUSEHOLD INCOME
34.7%
WAGE / INCOME GAP [ % ]
65.3¢/ $1
WAGE / INCOME GAP [ $ ]
0.45
INEQUALITY / GINI INDEX
1,133
TOTAL POPULATION
559
MALE POPULATION
574
FEMALE POPULATION
97.39
MALES / 100 FEMALES
102.68
FEMALES / 100 MALES
36.5
MEDIAN AGE
4.6
AVG FAMILY SIZE
3.5
AVG HOUSEHOLD SIZE
524
LABOR FORCE [ PEOPLE ]
62.3%
PERCENT IN LABOR FORCE
5.0%
UNEMPLOYMENT RATE
Camas County Area Codes
Income in Camas County
Income Overview in Camas County
Per Capita Income in Camas County is $34,790, while median incomes of families and households are $79,926 and $63,750 respectively.
| Characteristic | Number | Measure |
| Per Capita Income | 1,133 | $34,790 |
| Median Family Income | 209 | $79,926 |
| Mean Family Income | 209 | $105,975 |
| Median Household Income | 323 | $63,750 |
| Mean Household Income | 323 | $92,141 |
| Income Deficit | 209 | $0 |
| Wage / Income Gap (%) | 1,133 | 34.70% |
| Wage / Income Gap ($) | 1,133 | 65.30¢ per $1 |
| Gini / Inequality Index | 1,133 | 0.45 |
Earnings by Sex in Camas County
Average Earnings in Camas County are $31,875, $38,667 for men and $25,250 for women, a difference of 34.7%.

| Sex | Number | Average Earnings |
| Male | 300 (54.8%) | $38,667 |
| Female | 247 (45.2%) | $25,250 |
| Total | 547 (100.0%) | $31,875 |
Earnings by Sex by Income Bracket in Camas County
The most common earnings brackets in Camas County are $100,000+ for men (77 | 25.7%) and $45,000 to $49,999 for women (35 | 14.2%).

| Income | Male | Female |
| $2,499 or less | 18 (6.0%) | 14 (5.7%) |
| $2,500 to $4,999 | 17 (5.7%) | 14 (5.7%) |
| $5,000 to $7,499 | 3 (1.0%) | 5 (2.0%) |
| $7,500 to $9,999 | 0 (0.0%) | 0 (0.0%) |
| $10,000 to $12,499 | 8 (2.7%) | 15 (6.1%) |
| $12,500 to $14,999 | 10 (3.3%) | 30 (12.1%) |
| $15,000 to $17,499 | 26 (8.7%) | 0 (0.0%) |
| $17,500 to $19,999 | 7 (2.3%) | 26 (10.5%) |
| $20,000 to $22,499 | 4 (1.3%) | 6 (2.4%) |
| $22,500 to $24,999 | 5 (1.7%) | 13 (5.3%) |
| $25,000 to $29,999 | 26 (8.7%) | 13 (5.3%) |
| $30,000 to $34,999 | 2 (0.7%) | 18 (7.3%) |
| $35,000 to $39,999 | 32 (10.7%) | 7 (2.8%) |
| $40,000 to $44,999 | 4 (1.3%) | 23 (9.3%) |
| $45,000 to $49,999 | 3 (1.0%) | 35 (14.2%) |
| $50,000 to $54,999 | 1 (0.3%) | 2 (0.8%) |
| $55,000 to $64,999 | 34 (11.3%) | 3 (1.2%) |
| $65,000 to $74,999 | 6 (2.0%) | 9 (3.6%) |
| $75,000 to $99,999 | 17 (5.7%) | 6 (2.4%) |
| $100,000+ | 77 (25.7%) | 8 (3.2%) |
| Total | 300 (100.0%) | 247 (100.0%) |
Earnings by Sex by Educational Attainment in Camas County
Average earnings in Camas County are $55,833 for men and $31,328 for women, a difference of 43.9%. Men with an educational attainment of graduate degree enjoy the highest average annual earnings of $235,833, while those with college or associate's degree education earn the least with $27,778. Women with an educational attainment of college or associate's degree earn the most with the average annual earnings of $33,125, while those with less than high school education have the smallest earnings of $18,250.

| Educational Attainment | Male Income | Female Income |
| Less than High School | - | - |
| High School Diploma | $41,875 | $24,375 |
| College or Associate's Degree | $27,778 | $33,125 |
| Bachelor's Degree | $182,250 | $0 |
| Graduate Degree | $235,833 | $0 |
| Total | $55,833 | $31,328 |
Family Income in Camas County
Family Income Brackets in Camas County
According to the Camas County family income data, there are 49 families falling into the $75,000 to $99,999 income range, which is the most common income bracket and makes up 23.4% of all families.

| Income Bracket | # Families | % Families |
| Less than $10,000 | 0 | 0.0% |
| $10,000 to $14,999 | 0 | 0.0% |
| $15,000 to $24,999 | 0 | 0.0% |
| $25,000 to $34,999 | 27 | 12.9% |
| $35,000 to $49,999 | 22 | 10.5% |
| $50,000 to $74,999 | 36 | 17.2% |
| $75,000 to $99,999 | 49 | 23.4% |
| $100,000 to $149,999 | 40 | 19.1% |
| $150,000 to $199,999 | 11 | 5.3% |
| $200,000+ | 24 | 11.5% |
Family Income by Famaliy Size in Camas County
5-person families (10 | 4.8%) account for the highest median family income in Camas County with $140,000 per family, while 2-person families (130 | 62.2%) have the highest median income of $39,486 per family member.

| Income Bracket | # Families | Median Income |
| 2-Person Families | 130 (62.2%) | $78,971 |
| 3-Person Families | 9 (4.3%) | $71,250 |
| 4-Person Families | 29 (13.9%) | $95,938 |
| 5-Person Families | 10 (4.8%) | $140,000 |
| 6-Person Families | 22 (10.5%) | $0 |
| 7+ Person Families | 9 (4.3%) | $126,042 |
| Total | 209 (100.0%) | $79,926 |
Family Income by Number of Earners in Camas County
The median family income in Camas County is $79,926, with families comprising 3+ earners (14) having the highest median family income of $125,417, while families with 1 earner (68) have the lowest median family income of $70,833, accounting for 6.7% and 32.5% of families, respectively.

| Number of Earners | # Families | Median Income |
| No Earners | 32 (15.3%) | $75,833 |
| 1 Earner | 68 (32.5%) | $70,833 |
| 2 Earners | 95 (45.5%) | $88,125 |
| 3+ Earners | 14 (6.7%) | $125,417 |
| Total | 209 (100.0%) | $79,926 |
Household Income in Camas County
Household Income Brackets in Camas County
With 66 households falling in the category, the $35,000 to $49,999 income range is the most frequent in Camas County, accounting for 20.4% of all households.

| Income Bracket | # Households | % Households |
| Less than $10,000 | 0 | 0.0% |
| $10,000 to $14,999 | 20 | 6.2% |
| $15,000 to $24,999 | 4 | 1.2% |
| $25,000 to $34,999 | 46 | 14.2% |
| $35,000 to $49,999 | 66 | 20.4% |
| $50,000 to $74,999 | 38 | 11.8% |
| $75,000 to $99,999 | 51 | 15.8% |
| $100,000 to $149,999 | 47 | 14.6% |
| $150,000 to $199,999 | 11 | 3.4% |
| $200,000+ | 40 | 12.4% |
Household Income by Householder Age in Camas County
The median household income in Camas County is $63,750, with the highest median household income of $89,375 found in the 25 to 44 years age bracket for the primary householder. A total of 105 households (32.5%) fall into this category.

| Income Bracket | # Households | Median Income |
| 15 to 24 Years | 0 (0.0%) | $0 |
| 25 to 44 Years | 105 (32.5%) | $89,375 |
| 45 to 64 Years | 118 (36.5%) | $0 |
| 65+ Years | 100 (31.0%) | $64,167 |
| Total | 323 (100.0%) | $63,750 |
Poverty in Camas County
Income Below Poverty by Sex and Age in Camas County
With 6.3% poverty level for males and 7.1% for females among the residents of Camas County, 12 to 14 year old males and 12 to 14 year old females are the most vulnerable to poverty, with 5 males (31.2%) and 6 females (35.3%) in their respective age groups living below the poverty level.

| Age Bracket | Male | Female |
| Under 5 Years | 3 (5.3%) | 0 (0.0%) |
| 5 Years | 0 (0.0%) | 0 (0.0%) |
| 6 to 11 Years | 12 (24.0%) | 6 (6.2%) |
| 12 to 14 Years | 5 (31.2%) | 6 (35.3%) |
| 15 Years | 0 (0.0%) | 0 (0.0%) |
| 16 and 17 Years | 0 (0.0%) | 0 (0.0%) |
| 18 to 24 Years | 0 (0.0%) | 0 (0.0%) |
| 25 to 34 Years | 0 (0.0%) | 10 (17.2%) |
| 35 to 44 Years | 7 (9.2%) | 0 (0.0%) |
| 45 to 54 Years | 0 (0.0%) | 0 (0.0%) |
| 55 to 64 Years | 8 (13.6%) | 7 (10.1%) |
| 65 to 74 Years | 0 (0.0%) | 12 (35.3%) |
| 75 Years and over | 0 (0.0%) | 0 (0.0%) |
| Total | 35 (6.3%) | 41 (7.1%) |
Income Above Poverty by Sex and Age in Camas County
According to the poverty statistics in Camas County, males aged 5 years and females aged under 5 years are the age groups that are most secure financially, with 100.0% of males and 100.0% of females in these age groups living above the poverty line.

| Age Bracket | Male | Female |
| Under 5 Years | 54 (94.7%) | 18 (100.0%) |
| 5 Years | 7 (100.0%) | 10 (100.0%) |
| 6 to 11 Years | 38 (76.0%) | 90 (93.8%) |
| 12 to 14 Years | 11 (68.8%) | 11 (64.7%) |
| 15 Years | 6 (100.0%) | 15 (100.0%) |
| 16 and 17 Years | 28 (100.0%) | 22 (100.0%) |
| 18 to 24 Years | 34 (100.0%) | 24 (100.0%) |
| 25 to 34 Years | 86 (100.0%) | 48 (82.8%) |
| 35 to 44 Years | 69 (90.8%) | 127 (100.0%) |
| 45 to 54 Years | 50 (100.0%) | 56 (100.0%) |
| 55 to 64 Years | 51 (86.4%) | 62 (89.9%) |
| 65 to 74 Years | 30 (100.0%) | 22 (64.7%) |
| 75 Years and over | 60 (100.0%) | 28 (100.0%) |
| Total | 524 (93.7%) | 533 (92.9%) |
Income Below Poverty Among Married-Couple Families in Camas County
The poverty statistics for married-couple families in Camas County show that 2.8% or 5 of the total 182 families live below the poverty line. Families with 3 or 4 children have the highest poverty rate of 19.2%, comprising of 5 families. On the other hand, families with no children have the lowest poverty rate of 0.0%, which includes 0 families.

| Children | Above Poverty | Below Poverty |
| No Children | 118 (100.0%) | 0 (0.0%) |
| 1 or 2 Children | 36 (100.0%) | 0 (0.0%) |
| 3 or 4 Children | 21 (80.8%) | 5 (19.2%) |
| 5 or more Children | 2 (100.0%) | 0 (0.0%) |
| Total | 177 (97.3%) | 5 (2.8%) |
Income Below Poverty Among Single-Parent Households in Camas County

| Children | Single Father | Single Mother |
| No Children | 0 (0.0%) | 0 (0.0%) |
| 1 or 2 Children | 0 (0.0%) | 0 (0.0%) |
| 3 or 4 Children | 0 (0.0%) | 0 (0.0%) |
| 5 or more Children | 0 (0.0%) | 0 (0.0%) |
| Total | 0 (0.0%) | 0 (0.0%) |
Income Below Poverty Among Married-Couple vs Single-Parent Households in Camas County

| Children | Married-Couple Families | Single-Parent Households |
| No Children | 0 (0.0%) | 0 (0.0%) |
| 1 or 2 Children | 0 (0.0%) | 0 (0.0%) |
| 3 or 4 Children | 5 (19.2%) | 0 (0.0%) |
| 5 or more Children | 0 (0.0%) | 0 (0.0%) |
| Total | 5 (2.8%) | 0 (0.0%) |
Race in Camas County
The most populous races in Camas County are White / Caucasian (929 | 82.0%), Two or more Races (175 | 15.4%), and Hispanic or Latino (168 | 14.8%).

| Race | # Population | % Population |
| Asian | 0 | 0.0% |
| Black / African American | 0 | 0.0% |
| Hawaiian / Pacific | 0 | 0.0% |
| Hispanic or Latino | 168 | 14.8% |
| Native / Alaskan | 0 | 0.0% |
| White / Caucasian | 929 | 82.0% |
| Two or more Races | 175 | 15.4% |
| Some other Race | 29 | 2.6% |
| Total | 1,133 | 100.0% |
Ancestry in Camas County
The most populous ancestries reported in Camas County are German (167 | 14.7%), Irish (140 | 12.4%), American (136 | 12.0%), Mexican (102 | 9.0%), and English (100 | 8.8%), together accounting for 56.9% of all Camas County residents.

| Ancestry | # Population | % Population |
| American | 136 | 12.0% |
| Basque | 3 | 0.3% |
| British | 5 | 0.4% |
| Czech | 1 | 0.1% |
| Danish | 1 | 0.1% |
| Dutch | 3 | 0.3% |
| English | 100 | 8.8% |
| European | 16 | 1.4% |
| French | 9 | 0.8% |
| German | 167 | 14.7% |
| Greek | 10 | 0.9% |
| Irish | 140 | 12.4% |
| Italian | 35 | 3.1% |
| Mexican | 102 | 9.0% |
| Northern European | 3 | 0.3% |
| Norwegian | 13 | 1.1% |
| Polish | 28 | 2.5% |
| Scotch-Irish | 4 | 0.4% |
| Scottish | 32 | 2.8% |
| Spaniard | 66 | 5.8% |
| Swedish | 32 | 2.8% |
| Swiss | 12 | 1.1% |
| Welsh | 7 | 0.6% | View All 23 Rows |
Immigrants in Camas County
The most numerous immigrant groups reported in Camas County came from Central America (15 | 1.3%), Latin America (15 | 1.3%), and Mexico (15 | 1.3%), together accounting for 4.0% of all Camas County residents.

| Immigration Origin | # Population | % Population |
| Central America | 15 | 1.3% |
| Latin America | 15 | 1.3% |
| Mexico | 15 | 1.3% | View All 3 Rows |
Sex and Age in Camas County
Sex and Age in Camas County
The most populous age groups in Camas County are 15 to 19 Years (68 | 12.2%) for men and 40 to 44 Years (91 | 15.9%) for women.

| Age Bracket | Male | Female |
| Under 5 Years | 57 (10.2%) | 18 (3.1%) |
| 5 to 9 Years | 46 (8.2%) | 85 (14.8%) |
| 10 to 14 Years | 27 (4.8%) | 38 (6.6%) |
| 15 to 19 Years | 68 (12.2%) | 47 (8.2%) |
| 20 to 24 Years | 0 (0.0%) | 14 (2.4%) |
| 25 to 29 Years | 37 (6.6%) | 35 (6.1%) |
| 30 to 34 Years | 49 (8.8%) | 23 (4.0%) |
| 35 to 39 Years | 37 (6.6%) | 36 (6.3%) |
| 40 to 44 Years | 39 (7.0%) | 91 (15.9%) |
| 45 to 49 Years | 19 (3.4%) | 16 (2.8%) |
| 50 to 54 Years | 31 (5.6%) | 40 (7.0%) |
| 55 to 59 Years | 26 (4.6%) | 35 (6.1%) |
| 60 to 64 Years | 33 (5.9%) | 34 (5.9%) |
| 65 to 69 Years | 17 (3.0%) | 17 (3.0%) |
| 70 to 74 Years | 13 (2.3%) | 17 (3.0%) |
| 75 to 79 Years | 39 (7.0%) | 20 (3.5%) |
| 80 to 84 Years | 10 (1.8%) | 8 (1.4%) |
| 85 Years and over | 11 (2.0%) | 0 (0.0%) |
| Total | 559 (100.0%) | 574 (100.0%) |
Families and Households in Camas County
Median Family Size in Camas County
The median family size in Camas County is 4.63 persons per family, with single male/father families (3 | 1.4%) accounting for the largest median family size of 32 persons per family. On the other hand, married-couple families (182 | 87.1%) represent the smallest median family size with 3.82 persons per family.

| Family Type | # Families | Family Size |
| Married-Couple | 182 (87.1%) | 3.82 |
| Single Male/Father | 3 (1.4%) | 32.00 |
| Single Female/Mother | 24 (11.5%) | 7.33 |
| Total Families | 209 (100.0%) | 4.63 |
Median Household Size in Camas County
The median household size in Camas County is 3.51 persons per household, with single male/father households (3 | 0.9%) accounting for the largest median household size of 33.67 persons per household. non-family households (114 | 35.3%) represent the smallest median household size with 1.35 persons per household.

| Household Type | # Households | Household Size |
| Married-Couple | 182 (56.4%) | 3.82 |
| Single Male/Father | 3 (0.9%) | 33.67 |
| Single Female/Mother | 24 (7.4%) | 7.63 |
| Non-family | 114 (35.3%) | 1.35 |
| Total Households | 323 (100.0%) | 3.51 |
Household Size by Marriage Status in Camas County
Out of a total of 323 households in Camas County, 209 (64.7%) are family households, while 114 (35.3%) are nonfamily households. The most numerous type of family households are 2-person households, comprising 128, and the most common type of nonfamily households are 1-person households, comprising 95.

| Household Size | Family Households | Nonfamily Households |
| 1-Person Households | - | 95 (29.4%) |
| 2-Person Households | 128 (39.6%) | 19 (5.9%) |
| 3-Person Households | 4 (1.2%) | 0 (0.0%) |
| 4-Person Households | 36 (11.2%) | 0 (0.0%) |
| 5-Person Households | 10 (3.1%) | 0 (0.0%) |
| 6-Person Households | 22 (6.8%) | 0 (0.0%) |
| 7+ Person Households | 9 (2.8%) | 0 (0.0%) |
| Total | 209 (64.7%) | 114 (35.3%) |
Female Fertility in Camas County
Fertility by Age in Camas County
Average fertility rate in Camas County is 7.0 births per 1,000 women. Women in the age bracket of 35 to 50 years have the highest fertility rate with 13.0 births per 1,000 women. Women in the age bracket of 35 to 50 years acount for 100.0% of all women with births.

| Age Bracket | Women with Births | Births / 1,000 Women |
| 15 to 19 years | 0 (0.0%) | 0.0 |
| 20 to 34 years | 0 (0.0%) | 0.0 |
| 35 to 50 years | 2 (100.0%) | 13.0 |
| Total | 2 (100.0%) | 7.0 |
Fertility by Age by Marriage Status in Camas County

| Age Bracket | Married | Unmarried |
| 15 to 19 years | 0 (0.0%) | 0 (0.0%) |
| 20 to 34 years | 0 (0.0%) | 0 (0.0%) |
| 35 to 50 years | 2 (100.0%) | 0 (0.0%) |
| Total | 2 (100.0%) | 0 (0.0%) |
Fertility by Education in Camas County

| Educational Attainment | Women with Births | Births / 1,000 Women |
| Less than High School | 0 (0.0%) | 0.0 |
| High School Diploma | 0 (0.0%) | 0.0 |
| College or Associate's Degree | 0 (0.0%) | 0.0 |
| Bachelor's Degree | 2 (100.0%) | 61.0 |
| Graduate Degree | 0 (0.0%) | 0.0 |
| Total | 2 (100.0%) | 7.0 |
Fertility by Education by Marriage Status in Camas County

| Educational Attainment | Married | Unmarried |
| Less than High School | 0 (0.0%) | 0 (0.0%) |
| High School Diploma | 0 (0.0%) | 0 (0.0%) |
| College or Associate's Degree | 0 (0.0%) | 0 (0.0%) |
| Bachelor's Degree | 2 (100.0%) | 0 (0.0%) |
| Graduate Degree | 0 (0.0%) | 0 (0.0%) |
| Total | 2 (100.0%) | 0 (0.0%) |
Employment Characteristics in Camas County
Employment by Class of Employer in Camas County
Among the 465 employed individuals in Camas County, private company employees (256 | 55.0%), not-for-profit organizations (61 | 13.1%), and self-employed (incorporated) (45 | 9.7%) make up the most common classes of employment.

| Employer Class | # Employees | % Employees |
| Private Company Employees | 256 | 55.0% |
| Self-Employed (Incorporated) | 45 | 9.7% |
| Self-Employed (Not Incorporated) | 45 | 9.7% |
| Not-for-profit Organizations | 61 | 13.1% |
| Local Government Employees | 17 | 3.7% |
| State Government Employees | 38 | 8.2% |
| Federal Government Employees | 3 | 0.6% |
| Unpaid Family Workers | 0 | 0.0% |
| Total | 465 | 100.0% |
Employment Status by Age in Camas County
According to the labor force statistics for Camas County, out of the total population over 16 years of age (841), 62.3% or 524 individuals are in the labor force, with 5.0% or 26 of them unemployed. The age group with the highest labor force participation rate is 20 to 24 years, with 100.0% or 14 individuals in the labor force. Within the labor force, the 16 to 19 years age range has the highest percentage of unemployed individuals, with 33.8% or 26 of them being unemployed.

| Age Bracket | In Labor Force | Unemployed |
| 16 to 19 Years | 77 (81.9%) | 26 (33.8%) |
| 20 to 24 Years | 14 (100.0%) | 0 (0.0%) |
| 25 to 29 Years | 60 (83.3%) | 0 (0.0%) |
| 30 to 34 Years | 58 (80.6%) | 0 (0.0%) |
| 35 to 44 Years | 103 (50.7%) | 0 (0.0%) |
| 45 to 54 Years | 91 (85.8%) | 0 (0.0%) |
| 55 to 59 Years | 59 (96.7%) | 0 (0.0%) |
| 60 to 64 Years | 29 (43.3%) | 0 (0.0%) |
| 65 to 74 Years | 23 (35.9%) | 0 (0.0%) |
| 75 Years and over | 10 (11.4%) | 0 (0.0%) |
| Total | 524 (62.3%) | 26 (5.0%) |
Employment Status by Educational Attainment in Camas County

| Educational Attainment | In Labor Force | Unemployed |
| Less than High School | 17 (21.0%) | 0 (0.0%) |
| High School Diploma | 151 (76.3%) | 0 (0.0%) |
| College / Associate Degree | 113 (69.8%) | 0 (0.0%) |
| Bachelor's Degree or higher | 119 (85.0%) | 0 (0.0%) |
| Total | 400 (68.8%) | 0 (0.0%) |
Employment Occupations by Sex in Camas County
Management, Business, Science and Arts Occupations
The most common Management, Business, Science and Arts occupations in Camas County are Management (108 | 21.7%), Community & Social Service (40 | 8.0%), Education Instruction & Library (30 | 6.0%), Health Diagnosing & Treating (17 | 3.4%), and Business & Financial (15 | 3.0%).

Management, Business, Science and Arts Occupations by Sex
Within the Management, Business, Science and Arts occupations in Camas County, the most male-oriented occupations are Computers, Engineering & Science (100.0%), Architecture & Engineering (100.0%), and Management (64.8%), while the most female-oriented occupations are Arts, Media & Entertainment (100.0%), Education, Arts & Media (77.8%), and Community & Social Service (70.0%).

| Occupation | Male | Female |
| Management | 70 (64.8%) | 38 (35.2%) |
| Business & Financial | 7 (46.7%) | 8 (53.3%) |
| Computers, Engineering & Science | 2 (100.0%) | 0 (0.0%) |
| Computers & Mathematics | 0 (0.0%) | 0 (0.0%) |
| Architecture & Engineering | 2 (100.0%) | 0 (0.0%) |
| Life, Physical & Social Science | 0 (0.0%) | 0 (0.0%) |
| Community & Social Service | 12 (30.0%) | 28 (70.0%) |
| Education, Arts & Media | 2 (22.2%) | 7 (77.8%) |
| Legal Services & Support | 0 (0.0%) | 0 (0.0%) |
| Education Instruction & Library | 10 (33.3%) | 20 (66.7%) |
| Arts, Media & Entertainment | 0 (0.0%) | 1 (100.0%) |
| Health Diagnosing & Treating | 6 (35.3%) | 11 (64.7%) |
| Health Technologists | 6 (40.0%) | 9 (60.0%) |
| Total (Category) | 97 (53.3%) | 85 (46.7%) |
| Total (Overall) | 266 (53.4%) | 232 (46.6%) |
Services Occupations
The most common Services occupations in Camas County are Cleaning & Maintenance (58 | 11.7%), Food Preparation & Serving (23 | 4.6%), Security & Protection (3 | 0.6%), Firefighting & Prevention (3 | 0.6%), and Personal Care & Service (1 | 0.2%).

Services Occupations by Sex
Within the Services occupations in Camas County, the most male-oriented occupations are Security & Protection (100.0%), Firefighting & Prevention (100.0%), and Personal Care & Service (100.0%), while the most female-oriented occupations are Food Preparation & Serving (100.0%), and Cleaning & Maintenance (32.8%).

| Occupation | Male | Female |
| Healthcare Support | 0 (0.0%) | 0 (0.0%) |
| Security & Protection | 3 (100.0%) | 0 (0.0%) |
| Firefighting & Prevention | 3 (100.0%) | 0 (0.0%) |
| Law Enforcement | 0 (0.0%) | 0 (0.0%) |
| Food Preparation & Serving | 0 (0.0%) | 23 (100.0%) |
| Cleaning & Maintenance | 39 (67.2%) | 19 (32.8%) |
| Personal Care & Service | 1 (100.0%) | 0 (0.0%) |
| Total (Category) | 43 (50.6%) | 42 (49.4%) |
| Total (Overall) | 266 (53.4%) | 232 (46.6%) |
Sales and Office Occupations
The most common Sales and Office occupations in Camas County are Sales & Related (74 | 14.9%), and Office & Administration (58 | 11.7%).

Sales and Office Occupations by Sex

| Occupation | Male | Female |
| Sales & Related | 9 (12.2%) | 65 (87.8%) |
| Office & Administration | 18 (31.0%) | 40 (69.0%) |
| Total (Category) | 27 (20.4%) | 105 (79.5%) |
| Total (Overall) | 266 (53.4%) | 232 (46.6%) |
Natural Resources, Construction and Maintenance Occupations
The most common Natural Resources, Construction and Maintenance occupations in Camas County are Construction & Extraction (60 | 12.0%), Installation, Maintenance & Repair (8 | 1.6%), and Farming, Fishing & Forestry (1 | 0.2%).

Natural Resources, Construction and Maintenance Occupations by Sex

| Occupation | Male | Female |
| Farming, Fishing & Forestry | 1 (100.0%) | 0 (0.0%) |
| Construction & Extraction | 60 (100.0%) | 0 (0.0%) |
| Installation, Maintenance & Repair | 8 (100.0%) | 0 (0.0%) |
| Total (Category) | 69 (100.0%) | 0 (0.0%) |
| Total (Overall) | 266 (53.4%) | 232 (46.6%) |
Production, Transportation and Moving Occupations
The most common Production, Transportation and Moving occupations in Camas County are Production (20 | 4.0%), and Material Moving (10 | 2.0%).

Production, Transportation and Moving Occupations by Sex

| Occupation | Male | Female |
| Production | 20 (100.0%) | 0 (0.0%) |
| Transportation | 0 (0.0%) | 0 (0.0%) |
| Material Moving | 10 (100.0%) | 0 (0.0%) |
| Total (Category) | 30 (100.0%) | 0 (0.0%) |
| Total (Overall) | 266 (53.4%) | 232 (46.6%) |
Employment Industries by Sex in Camas County
Employment Industries in Camas County
The major employment industries in Camas County include Health Care & Social Assistance (85 | 17.1%), Construction (71 | 14.3%), Retail Trade (68 | 13.7%), Accommodation & Food Services (57 | 11.5%), and Agriculture, Fishing & Hunting (45 | 9.0%).

Employment Industries by Sex in Camas County
The Camas County industries that see more men than women are Mining, Quarrying, & Extraction (100.0%), Wholesale Trade (100.0%), and Transportation & Warehousing (100.0%), whereas the industries that tend to have a higher number of women are Information (100.0%), Finance & Insurance (100.0%), and Public Administration (100.0%).

| Industry | Male | Female |
| Agriculture, Fishing & Hunting | 40 (88.9%) | 5 (11.1%) |
| Mining, Quarrying, & Extraction | 1 (100.0%) | 0 (0.0%) |
| Construction | 66 (93.0%) | 5 (7.0%) |
| Manufacturing | 9 (64.3%) | 5 (35.7%) |
| Wholesale Trade | 12 (100.0%) | 0 (0.0%) |
| Retail Trade | 28 (41.2%) | 40 (58.8%) |
| Transportation & Warehousing | 9 (100.0%) | 0 (0.0%) |
| Utilities | 2 (100.0%) | 0 (0.0%) |
| Information | 0 (0.0%) | 1 (100.0%) |
| Finance & Insurance | 0 (0.0%) | 20 (100.0%) |
| Real Estate, Rental & Leasing | 3 (42.9%) | 4 (57.1%) |
| Professional & Scientific | 2 (25.0%) | 6 (75.0%) |
| Enterprise Management | 0 (0.0%) | 0 (0.0%) |
| Administrative & Support | 18 (66.7%) | 9 (33.3%) |
| Educational Services | 2 (5.9%) | 32 (94.1%) |
| Health Care & Social Assistance | 32 (37.7%) | 53 (62.4%) |
| Arts, Entertainment & Recreation | 9 (100.0%) | 0 (0.0%) |
| Accommodation & Food Services | 20 (35.1%) | 37 (64.9%) |
| Public Administration | 0 (0.0%) | 12 (100.0%) |
| Total | 266 (53.4%) | 232 (46.6%) |
Education in Camas County
School Enrollment in Camas County
The most common levels of schooling among the 345 students in Camas County are elementary school (117 | 33.9%), high school (97 | 28.1%), and college / undergraduate (55 | 15.9%).

| School Level | # Students | % Students |
| Nursery / Preschool | 0 | 0.0% |
| Kindergarten | 20 | 5.8% |
| Elementary School | 117 | 33.9% |
| Middle School | 54 | 15.7% |
| High School | 97 | 28.1% |
| College / Undergraduate | 55 | 15.9% |
| Graduate / Professional | 2 | 0.6% |
| Total | 345 | 100.0% |
School Enrollment by Age by Funding Source in Camas County
Out of a total of 345 students who are enrolled in schools in Camas County, 8 (2.3%) attend a private institution, while the remaining 337 (97.7%) are enrolled in public schools. The age group of 10 to 14 year olds has the highest likelihood of being enrolled in private schools, with 3 (4.6% in the age bracket) enrolled. Conversely, the age group of 15 to 17 year olds has the lowest likelihood of being enrolled in a private school, with 71 (100.0% in the age bracket) attending a public institution.

| Age Bracket | Public School | Private School |
| 3 to 4 Year Olds | 0 (0.0%) | 0 (0.0%) |
| 5 to 9 Year Old | 121 (96.0%) | 5 (4.0%) |
| 10 to 14 Year Olds | 62 (95.4%) | 3 (4.6%) |
| 15 to 17 Year Olds | 71 (100.0%) | 0 (0.0%) |
| 18 to 19 Year Olds | 36 (100.0%) | 0 (0.0%) |
| 20 to 24 Year Olds | 14 (100.0%) | 0 (0.0%) |
| 25 to 34 Year Olds | 33 (100.0%) | 0 (0.0%) |
| 35 Years and over | 0 (0.0%) | 0 (0.0%) |
| Total | 337 (97.7%) | 8 (2.3%) |
Educational Attainment by Field of Study in Camas County
Science & technology (60 | 27.5%), education (38 | 17.4%), business (31 | 14.2%), bio, nature & agricultural (28 | 12.8%), and social sciences (14 | 6.4%) are the most common fields of study among 218 individuals in Camas County who have obtained a bachelor's degree or higher.

| Field of Study | # Graduates | % Graduates |
| Computers & Mathematics | 4 | 1.8% |
| Bio, Nature & Agricultural | 28 | 12.8% |
| Physical & Health Sciences | 6 | 2.8% |
| Psychology | 6 | 2.8% |
| Social Sciences | 14 | 6.4% |
| Engineering | 0 | 0.0% |
| Multidisciplinary Studies | 0 | 0.0% |
| Science & Technology | 60 | 27.5% |
| Business | 31 | 14.2% |
| Education | 38 | 17.4% |
| Literature & Languages | 13 | 6.0% |
| Liberal Arts & History | 10 | 4.6% |
| Visual & Performing Arts | 0 | 0.0% |
| Communications | 0 | 0.0% |
| Arts & Humanities | 8 | 3.7% |
| Total | 218 | 100.0% |
Transportation & Commute in Camas County
Vehicle Availability by Sex in Camas County
The most prevalent vehicle ownership categories in Camas County are males with 2 vehicles (118, accounting for 50.6%) and females with 2 vehicles (114, making up 50.9%).

| Vehicles Available | Male | Female |
| No Vehicle | 0 (0.0%) | 0 (0.0%) |
| 1 Vehicle | 11 (4.7%) | 33 (14.2%) |
| 2 Vehicles | 118 (50.6%) | 114 (49.1%) |
| 3 Vehicles | 51 (21.9%) | 47 (20.3%) |
| 4 Vehicles | 34 (14.6%) | 0 (0.0%) |
| 5 or more Vehicles | 19 (8.2%) | 38 (16.4%) |
| Total | 233 (100.0%) | 232 (100.0%) |
Commute Time in Camas County
The most frequently occuring commute durations in Camas County are 60 to 89 minutes (107 commuters, 26.4%), 45 to 59 minutes (74 commuters, 18.2%), and less than 5 minutes (51 commuters, 12.6%).

| Commute Time | # Commuters | % Commuters |
| Less than 5 Minutes | 51 | 12.6% |
| 5 to 9 Minutes | 33 | 8.1% |
| 10 to 14 Minutes | 22 | 5.4% |
| 15 to 19 Minutes | 21 | 5.2% |
| 20 to 24 Minutes | 0 | 0.0% |
| 25 to 29 Minutes | 0 | 0.0% |
| 30 to 34 Minutes | 24 | 5.9% |
| 35 to 39 Minutes | 30 | 7.4% |
| 40 to 44 Minutes | 8 | 2.0% |
| 45 to 59 Minutes | 74 | 18.2% |
| 60 to 89 Minutes | 107 | 26.4% |
| 90 or more Minutes | 36 | 8.9% |
Commute Time by Sex in Camas County
The most common commute times in Camas County are 60 to 89 minutes (58 commuters, 30.0%) for males and 45 to 59 minutes (54 commuters, 25.4%) for females.

| Commute Time | Male | Female |
| Less than 5 Minutes | 18 (9.3%) | 33 (15.5%) |
| 5 to 9 Minutes | 5 (2.6%) | 28 (13.2%) |
| 10 to 14 Minutes | 2 (1.0%) | 20 (9.4%) |
| 15 to 19 Minutes | 7 (3.6%) | 14 (6.6%) |
| 20 to 24 Minutes | 0 (0.0%) | 0 (0.0%) |
| 25 to 29 Minutes | 0 (0.0%) | 0 (0.0%) |
| 30 to 34 Minutes | 19 (9.8%) | 5 (2.4%) |
| 35 to 39 Minutes | 26 (13.5%) | 4 (1.9%) |
| 40 to 44 Minutes | 2 (1.0%) | 6 (2.8%) |
| 45 to 59 Minutes | 20 (10.4%) | 54 (25.4%) |
| 60 to 89 Minutes | 58 (30.0%) | 49 (23.0%) |
| 90 or more Minutes | 36 (18.6%) | 0 (0.0%) |
Time of Departure to Work by Sex in Camas County
The most frequent times of departure to work in Camas County are 7:00 AM to 7:29 AM (53, 27.5%) for males and 12:00 PM to 3:59 PM (41, 19.3%) for females.
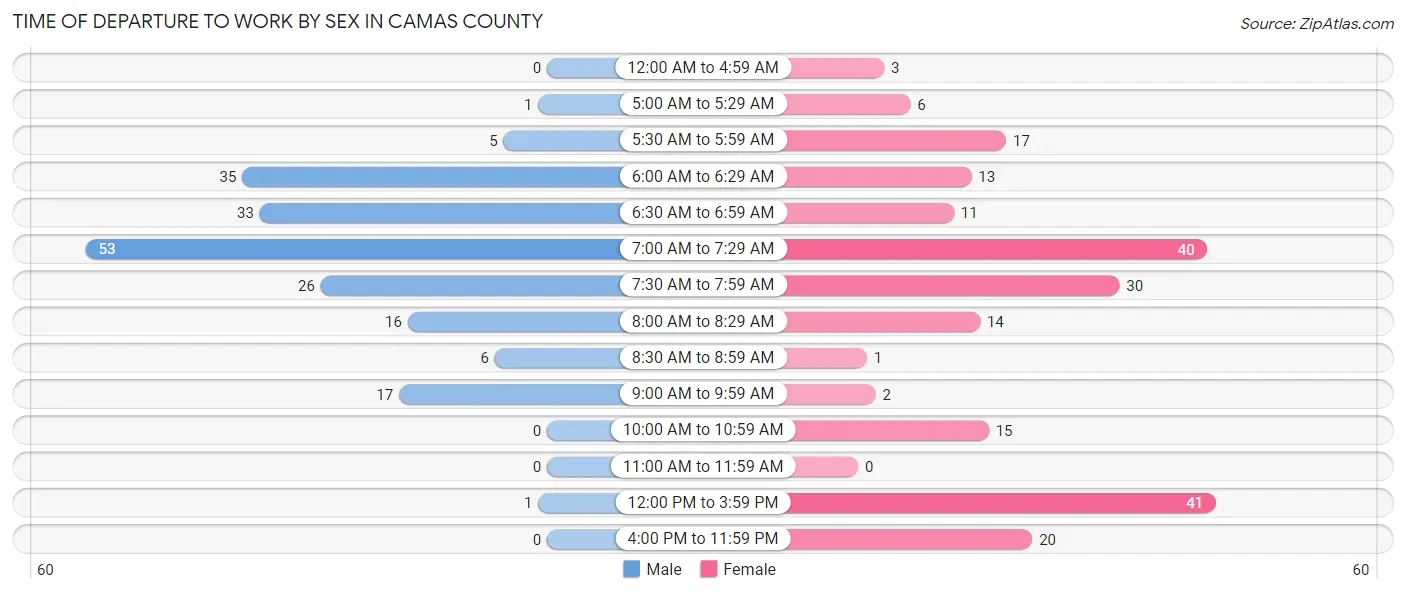
| Time of Departure | Male | Female |
| 12:00 AM to 4:59 AM | 0 (0.0%) | 3 (1.4%) |
| 5:00 AM to 5:29 AM | 1 (0.5%) | 6 (2.8%) |
| 5:30 AM to 5:59 AM | 5 (2.6%) | 17 (8.0%) |
| 6:00 AM to 6:29 AM | 35 (18.1%) | 13 (6.1%) |
| 6:30 AM to 6:59 AM | 33 (17.1%) | 11 (5.2%) |
| 7:00 AM to 7:29 AM | 53 (27.5%) | 40 (18.8%) |
| 7:30 AM to 7:59 AM | 26 (13.5%) | 30 (14.1%) |
| 8:00 AM to 8:29 AM | 16 (8.3%) | 14 (6.6%) |
| 8:30 AM to 8:59 AM | 6 (3.1%) | 1 (0.5%) |
| 9:00 AM to 9:59 AM | 17 (8.8%) | 2 (0.9%) |
| 10:00 AM to 10:59 AM | 0 (0.0%) | 15 (7.0%) |
| 11:00 AM to 11:59 AM | 0 (0.0%) | 0 (0.0%) |
| 12:00 PM to 3:59 PM | 1 (0.5%) | 41 (19.3%) |
| 4:00 PM to 11:59 PM | 0 (0.0%) | 20 (9.4%) |
| Total | 193 (100.0%) | 213 (100.0%) |
Housing Occupancy in Camas County
Occupancy by Ownership in Camas County
Of the total 323 dwellings in Camas County, owner-occupied units account for 246 (76.2%), while renter-occupied units make up 77 (23.8%).

| Occupancy | # Housing Units | % Housing Units |
| Owner Occupied Housing Units | 246 | 76.2% |
| Renter-Occupied Housing Units | 77 | 23.8% |
| Total Occupied Housing Units | 323 | 100.0% |
Occupancy by Household Size in Camas County

| Household Size | # Housing Units | % Housing Units |
| 1-Person Household | 95 | 29.4% |
| 2-Person Household | 147 | 45.5% |
| 3-Person Household | 4 | 1.2% |
| 4+ Person Household | 77 | 23.8% |
| Total Housing Units | 323 | 100.0% |
Occupancy by Ownership by Household Size in Camas County

| Household Size | Owner-occupied | Renter-occupied |
| 1-Person Household | 66 (69.5%) | 29 (30.5%) |
| 2-Person Household | 122 (83.0%) | 25 (17.0%) |
| 3-Person Household | 2 (50.0%) | 2 (50.0%) |
| 4+ Person Household | 56 (72.7%) | 21 (27.3%) |
| Total Housing Units | 246 (76.2%) | 77 (23.8%) |
Occupancy by Educational Attainment in Camas County

| Household Size | Owner-occupied | Renter-occupied |
| Less than High School | 0 (0.0%) | 13 (100.0%) |
| High School Diploma | 81 (89.0%) | 10 (11.0%) |
| College/Associate Degree | 101 (72.1%) | 39 (27.9%) |
| Bachelor's Degree or higher | 64 (81.0%) | 15 (19.0%) |
Occupancy by Age of Householder in Camas County

| Age Bracket | # Households | % Households |
| Under 35 Years | 48 | 14.9% |
| 35 to 44 Years | 57 | 17.6% |
| 45 to 54 Years | 54 | 16.7% |
| 55 to 64 Years | 64 | 19.8% |
| 65 to 74 Years | 50 | 15.5% |
| 75 to 84 Years | 50 | 15.5% |
| 85 Years and Over | 0 | 0.0% |
| Total | 323 | 100.0% |
Housing Finances in Camas County
Median Income by Occupancy in Camas County

| Occupancy Type | # Households | Median Income |
| Owner-Occupied | 246 (76.2%) | $70,833 |
| Renter-Occupied | 77 (23.8%) | $50,417 |
| Average | 323 (100.0%) | $63,750 |
Occupancy by Householder Income Bracket in Camas County

| Income Bracket | Owner-occupied | Renter-occupied |
| Less than $5,000 | 0 (0.0%) | 0 (0.0%) |
| $5,000 to $9,999 | 0 (0.0%) | 0 (0.0%) |
| $10,000 to $14,999 | 8 (3.3%) | 12 (15.6%) |
| $15,000 to $19,999 | 0 (0.0%) | 0 (0.0%) |
| $20,000 to $24,999 | 4 (1.6%) | 0 (0.0%) |
| $25,000 to $34,999 | 42 (17.1%) | 4 (5.2%) |
| $35,000 to $49,999 | 44 (17.9%) | 22 (28.6%) |
| $50,000 to $74,999 | 31 (12.6%) | 7 (9.1%) |
| $75,000 to $99,999 | 41 (16.7%) | 10 (13.0%) |
| $100,000 to $149,999 | 42 (17.1%) | 5 (6.5%) |
| $150,000 or more | 34 (13.8%) | 17 (22.1%) |
| Total | 246 (100.0%) | 77 (100.0%) |
Monthly Housing Cost Tiers in Camas County

| Monthly Cost | Owner-occupied | Renter-occupied |
| Less than $300 | 18 (7.3%) | 0 (0.0%) |
| $300 to $499 | 34 (13.8%) | 5 (6.5%) |
| $500 to $799 | 29 (11.8%) | 7 (9.1%) |
| $800 to $999 | 26 (10.6%) | 16 (20.8%) |
| $1,000 to $1,499 | 64 (26.0%) | 13 (16.9%) |
| $1,500 to $1,999 | 59 (24.0%) | 3 (3.9%) |
| $2,000 to $2,499 | 6 (2.4%) | 0 (0.0%) |
| $2,500 to $2,999 | 6 (2.4%) | 0 (0.0%) |
| $3,000 or more | 4 (1.6%) | 0 (0.0%) |
| Total | 246 (100.0%) | 77 (100.0%) |
Physical Housing Characteristics in Camas County
Housing Structures in Camas County

| Structure Type | # Housing Units | % Housing Units |
| Single Unit, Detached | 274 | 84.8% |
| Single Unit, Attached | 1 | 0.3% |
| 2 Unit Apartments | 5 | 1.5% |
| 3 or 4 Unit Apartments | 5 | 1.5% |
| 5 to 9 Unit Apartments | 0 | 0.0% |
| 10 or more Apartments | 0 | 0.0% |
| Mobile Home / Other | 38 | 11.8% |
| Total | 323 | 100.0% |
Housing Structures by Occupancy in Camas County

| Structure Type | Owner-occupied | Renter-occupied |
| Single Unit, Detached | 221 (80.7%) | 53 (19.3%) |
| Single Unit, Attached | 1 (100.0%) | 0 (0.0%) |
| 2 Unit Apartments | 5 (100.0%) | 0 (0.0%) |
| 3 or 4 Unit Apartments | 0 (0.0%) | 5 (100.0%) |
| 5 to 9 Unit Apartments | 0 (0.0%) | 0 (0.0%) |
| 10 or more Apartments | 0 (0.0%) | 0 (0.0%) |
| Mobile Home / Other | 19 (50.0%) | 19 (50.0%) |
| Total | 246 (76.2%) | 77 (23.8%) |
Housing Structures by Number of Rooms in Camas County

| Number of Rooms | Owner-occupied | Renter-occupied |
| 1 Room | 0 (0.0%) | 0 (0.0%) |
| 2 or 3 Rooms | 21 (8.5%) | 15 (19.5%) |
| 4 or 5 Rooms | 89 (36.2%) | 39 (50.6%) |
| 6 or 7 Rooms | 95 (38.6%) | 23 (29.9%) |
| 8 or more Rooms | 41 (16.7%) | 0 (0.0%) |
| Total | 246 (100.0%) | 77 (100.0%) |
Housing Structure by Heating Type in Camas County

| Heating Type | Owner-occupied | Renter-occupied |
| Utility Gas | 4 (1.6%) | 0 (0.0%) |
| Bottled, Tank, or LP Gas | 69 (28.1%) | 2 (2.6%) |
| Electricity | 81 (32.9%) | 49 (63.6%) |
| Fuel Oil or Kerosene | 9 (3.7%) | 22 (28.6%) |
| Coal or Coke | 13 (5.3%) | 0 (0.0%) |
| All other Fuels | 70 (28.5%) | 4 (5.2%) |
| No Fuel Used | 0 (0.0%) | 0 (0.0%) |
| Total | 246 (100.0%) | 77 (100.0%) |
Household Vehicle Usage in Camas County

| Vehicles per Household | Owner-occupied | Renter-occupied |
| No Vehicle | 0 (0.0%) | 5 (6.5%) |
| 1 Vehicle | 39 (15.9%) | 17 (22.1%) |
| 2 Vehicles | 94 (38.2%) | 39 (50.6%) |
| 3 or more Vehicles | 113 (45.9%) | 16 (20.8%) |
| Total | 246 (100.0%) | 77 (100.0%) |
Real Estate & Mortgages in Camas County
Real Estate and Mortgage Overview in Camas County
| Characteristic | Without Mortgage | With Mortgage |
| Housing Units | 85 | 161 |
| Median Property Value | $233,900 | $219,300 |
| Median Household Income | $77,917 | $22 |
| Monthly Housing Costs | $450 | $4 |
| Real Estate Taxes | $1,266 | $4 |
Property Value by Mortgage Status in Camas County

| Property Value | Without Mortgage | With Mortgage |
| Less than $50,000 | 3 (3.5%) | 1 (0.6%) |
| $50,000 to $99,999 | 12 (14.1%) | 16 (9.9%) |
| $100,000 to $299,999 | 44 (51.8%) | 79 (49.1%) |
| $300,000 to $499,999 | 15 (17.6%) | 40 (24.8%) |
| $500,000 to $749,999 | 0 (0.0%) | 12 (7.4%) |
| $750,000 to $999,999 | 7 (8.2%) | 13 (8.1%) |
| $1,000,000 or more | 4 (4.7%) | 0 (0.0%) |
| Total | 85 (100.0%) | 161 (100.0%) |
Household Income by Mortgage Status in Camas County

| Household Income | Without Mortgage | With Mortgage |
| Less than $10,000 | 0 (0.0%) | 7 (4.3%) |
| $10,000 to $24,999 | 8 (9.4%) | 0 (0.0%) |
| $25,000 to $34,999 | 6 (7.1%) | 4 (2.5%) |
| $35,000 to $49,999 | 6 (7.1%) | 36 (22.4%) |
| $50,000 to $74,999 | 19 (22.4%) | 38 (23.6%) |
| $75,000 to $99,999 | 14 (16.5%) | 12 (7.4%) |
| $100,000 to $149,999 | 20 (23.5%) | 27 (16.8%) |
| $150,000 or more | 12 (14.1%) | 22 (13.7%) |
| Total | 85 (100.0%) | 161 (100.0%) |
Property Value to Household Income Ratio in Camas County

| Value-to-Income Ratio | Without Mortgage | With Mortgage |
| Less than 2.0x | 37 (43.5%) | 61,250 (38,043.5%) |
| 2.0x to 2.9x | 6 (7.1%) | 30 (18.6%) |
| 3.0x to 3.9x | 4 (4.7%) | 25 (15.5%) |
| 4.0x or more | 38 (44.7%) | 27 (16.8%) |
| Total | 85 (100.0%) | 161 (100.0%) |
Real Estate Taxes by Mortgage Status in Camas County

| Property Taxes | Without Mortgage | With Mortgage |
| Less than $800 | 26 (30.6%) | 0 (0.0%) |
| $800 to $1,499 | 31 (36.5%) | 31 (19.3%) |
| $800 to $1,499 | 28 (32.9%) | 73 (45.3%) |
| Total | 85 (100.0%) | 161 (100.0%) |
Health & Disability in Camas County
Health Insurance Coverage by Age in Camas County

| Age Bracket | With Coverage | Without Coverage |
| Under 6 Years | 87 (94.6%) | 5 (5.4%) |
| 6 to 18 Years | 273 (95.5%) | 13 (4.5%) |
| 19 to 25 Years | 25 (100.0%) | 0 (0.0%) |
| 26 to 34 Years | 91 (64.5%) | 50 (35.5%) |
| 35 to 44 Years | 189 (93.1%) | 14 (6.9%) |
| 45 to 54 Years | 86 (81.1%) | 20 (18.9%) |
| 55 to 64 Years | 115 (89.8%) | 13 (10.2%) |
| 65 to 74 Years | 59 (92.2%) | 5 (7.8%) |
| 75 Years and older | 88 (100.0%) | 0 (0.0%) |
| Total | 1,013 (89.4%) | 120 (10.6%) |
Health Insurance Coverage by Citizenship Status in Camas County

| Citizenship Status | With Coverage | Without Coverage |
| Native Born | 87 (94.6%) | 5 (5.4%) |
| Foreign Born, Citizen | 273 (95.5%) | 13 (4.5%) |
| Foreign Born, not a Citizen | 25 (100.0%) | 0 (0.0%) |
Health Insurance Coverage by Household Income in Camas County
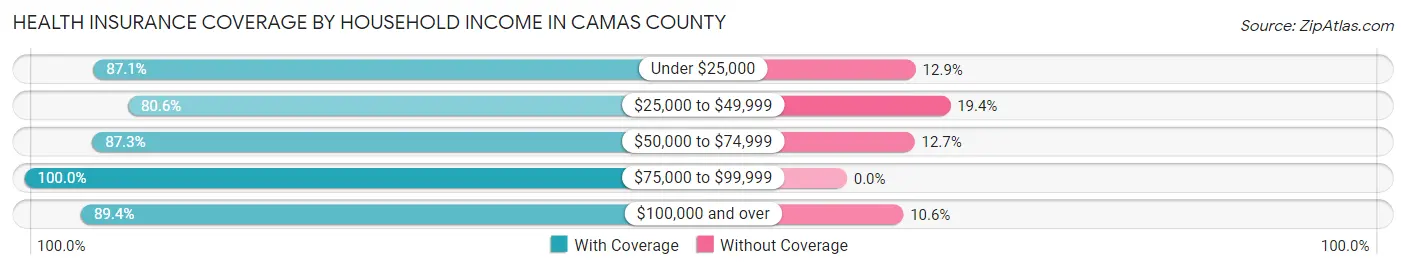
| Household Income | With Coverage | Without Coverage |
| Under $25,000 | 27 (87.1%) | 4 (12.9%) |
| $25,000 to $49,999 | 179 (80.6%) | 43 (19.4%) |
| $50,000 to $74,999 | 117 (87.3%) | 17 (12.7%) |
| $75,000 to $99,999 | 216 (100.0%) | 0 (0.0%) |
| $100,000 and over | 474 (89.4%) | 56 (10.6%) |
Public vs Private Health Insurance Coverage by Age in Camas County

| Age Bracket | Public Insurance | Private Insurance |
| Under 6 | 36 (39.1%) | 51 (55.4%) |
| 6 to 18 Years | 79 (27.6%) | 200 (69.9%) |
| 19 to 25 Years | 3 (12.0%) | 22 (88.0%) |
| 25 to 34 Years | 30 (21.3%) | 61 (43.3%) |
| 35 to 44 Years | 93 (45.8%) | 96 (47.3%) |
| 45 to 54 Years | 33 (31.1%) | 53 (50.0%) |
| 55 to 64 Years | 16 (12.5%) | 104 (81.2%) |
| 65 to 74 Years | 53 (82.8%) | 24 (37.5%) |
| 75 Years and over | 88 (100.0%) | 72 (81.8%) |
| Total | 431 (38.0%) | 683 (60.3%) |
Disability Status by Sex by Age in Camas County

| Age Bracket | Male | Female |
| Under 5 Years | 0 (0.0%) | 0 (0.0%) |
| 5 to 17 Years | 0 (0.0%) | 0 (0.0%) |
| 18 to 34 Years | 0 (0.0%) | 0 (0.0%) |
| 35 to 64 Years | 13 (7.0%) | 83 (32.9%) |
| 65 to 74 Years | 3 (10.0%) | 19 (55.9%) |
| 75 Years and over | 46 (76.7%) | 12 (42.9%) |
Disability Class by Sex by Age in Camas County
Disability Class: Hearing Difficulty

| Age Bracket | Male | Female |
| Under 5 Years | 0 (0.0%) | 0 (0.0%) |
| 5 to 17 Years | 0 (0.0%) | 0 (0.0%) |
| 18 to 34 Years | 0 (0.0%) | 0 (0.0%) |
| 35 to 64 Years | 12 (6.5%) | 5 (2.0%) |
| 65 to 74 Years | 0 (0.0%) | 0 (0.0%) |
| 75 Years and over | 46 (76.7%) | 4 (14.3%) |
Disability Class: Vision Difficulty

| Age Bracket | Male | Female |
| Under 5 Years | 0 (0.0%) | 0 (0.0%) |
| 5 to 17 Years | 0 (0.0%) | 0 (0.0%) |
| 18 to 34 Years | 0 (0.0%) | 0 (0.0%) |
| 35 to 64 Years | 0 (0.0%) | 0 (0.0%) |
| 65 to 74 Years | 0 (0.0%) | 0 (0.0%) |
| 75 Years and over | 21 (35.0%) | 5 (17.9%) |
Disability Class: Cognitive Difficulty

| Age Bracket | Male | Female |
| 5 to 17 Years | 0 (0.0%) | 0 (0.0%) |
| 18 to 34 Years | 0 (0.0%) | 0 (0.0%) |
| 35 to 64 Years | 6 (3.2%) | 0 (0.0%) |
| 65 to 74 Years | 0 (0.0%) | 7 (20.6%) |
| 75 Years and over | 21 (35.0%) | 0 (0.0%) |
Disability Class: Ambulatory Difficulty

| Age Bracket | Male | Female |
| 5 to 17 Years | 0 (0.0%) | 0 (0.0%) |
| 18 to 34 Years | 0 (0.0%) | 0 (0.0%) |
| 35 to 64 Years | 5 (2.7%) | 83 (32.9%) |
| 65 to 74 Years | 3 (10.0%) | 12 (35.3%) |
| 75 Years and over | 5 (8.3%) | 3 (10.7%) |
Disability Class: Self-Care Difficulty

| Age Bracket | Male | Female |
| 5 to 17 Years | 0 (0.0%) | 0 (0.0%) |
| 18 to 34 Years | 0 (0.0%) | 0 (0.0%) |
| 35 to 64 Years | 5 (2.7%) | 0 (0.0%) |
| 65 to 74 Years | 0 (0.0%) | 0 (0.0%) |
| 75 Years and over | 5 (8.3%) | 0 (0.0%) |
Technology Access in Camas County
Computing Device Access in Camas County

| Device Type | # Households | % Households |
| Desktop or Laptop | 275 | 85.1% |
| Smartphone | 298 | 92.3% |
| Tablet | 142 | 44.0% |
| No Computing Device | 13 | 4.0% |
| Total | 323 | 100.0% |
Internet Access in Camas County

| Internet Type | # Households | % Households |
| Dial-Up Internet | 0 | 0.0% |
| Broadband Home | 160 | 49.5% |
| Cellular Data Only | 28 | 8.7% |
| Satellite Internet | 104 | 32.2% |
| No Internet | 47 | 14.5% |
| Total | 323 | 100.0% |
Camas County Summary
Camas County is located in the southeastern corner of Idaho, bordered by Wyoming to the east and Utah to the south. It is part of the Snake River Plain, a region of flat, arid land that stretches across the state. The county seat is Fairfield, and the largest city is Burley. The county was established in 1917 and named after the Camas flower, which grows in the area.
Geography
Camas County covers an area of 1,845 square miles, making it the fourth-largest county in Idaho. The terrain is mostly flat, with some rolling hills in the north and east. The Snake River runs through the county, and there are several small lakes and reservoirs. The climate is semi-arid, with hot summers and cold winters.
The county is divided into two distinct regions. The northern half is part of the Snake River Plain, while the southern half is part of the Great Basin. The Snake River Plain is characterized by flat terrain and sparse vegetation, while the Great Basin is more rugged and has more vegetation.
Demographics
As of the 2010 census, the population of Camas County was 11,854. The population has been steadily increasing since 2000, when it was 10,845. The population is predominantly white (94.3%), with small percentages of Hispanic (2.7%), Native American (1.2%), and Asian (0.7%) residents.
The median household income in Camas County is $41,945, slightly lower than the state median of $43,906. The median home value is $117,400, also lower than the state median of $139,400. The unemployment rate is 4.2%, slightly higher than the state average of 3.9%.
Economy
The economy of Camas County is largely based on agriculture. The county is home to several large farms, which produce a variety of crops, including potatoes, wheat, corn, and hay. Livestock production is also important, with cattle, sheep, and horses being raised in the area.
The county is also home to several manufacturing companies, including a potato processing plant and a dairy processing plant. The county is also home to several retail stores, restaurants, and other businesses.
The county is served by two airports, the Burley Municipal Airport and the Camas County Airport. The county is also served by several highways, including Interstate 84, US Highway 30, and Idaho State Highway 24.
Conclusion
Camas County is a rural county in southeastern Idaho. It is home to a diverse population and a largely agricultural economy. The county is served by two airports and several highways, making it easily accessible. The county has seen steady population growth since 2000, and its economy is largely based on agriculture and manufacturing.
Common Questions
What is Per Capita Income in Camas County?
Per Capita income in Camas County is $34,790.
What is the Median Family Income in Camas County?
Median Family Income in Camas County is $79,926.
What is the Median Household income in Camas County?
Median Household Income in Camas County is $63,750.
What is Income or Wage Gap in Camas County?
Income or Wage Gap in Camas County is 34.7%.
Women in Camas County earn 65.3 cents for every dollar earned by a man.
What is Inequality or Gini Index in Camas County?
Inequality or Gini Index in Camas County is 0.45.
What is the Total Population of Camas County?
Total Population of Camas County is 1,133.
What is the Total Male Population of Camas County?
Total Male Population of Camas County is 559.
What is the Total Female Population of Camas County?
Total Female Population of Camas County is 574.
What is the Ratio of Males per 100 Females in Camas County?
There are 97.39 Males per 100 Females in Camas County.
What is the Ratio of Females per 100 Males in Camas County?
There are 102.68 Females per 100 Males in Camas County.
What is the Median Population Age in Camas County?
Median Population Age in Camas County is 36.5 Years.
What is the Average Family Size in Camas County
Average Family Size in Camas County is 4.6 People.
What is the Average Household Size in Camas County
Average Household Size in Camas County is 3.5 People.
How Large is the Labor Force in Camas County?
There are 524 People in the Labor Forcein in Camas County.
What is the Percentage of People in the Labor Force in Camas County?
62.3% of People are in the Labor Force in Camas County.
What is the Unemployment Rate in Camas County?
Unemployment Rate in Camas County is 5.0%.