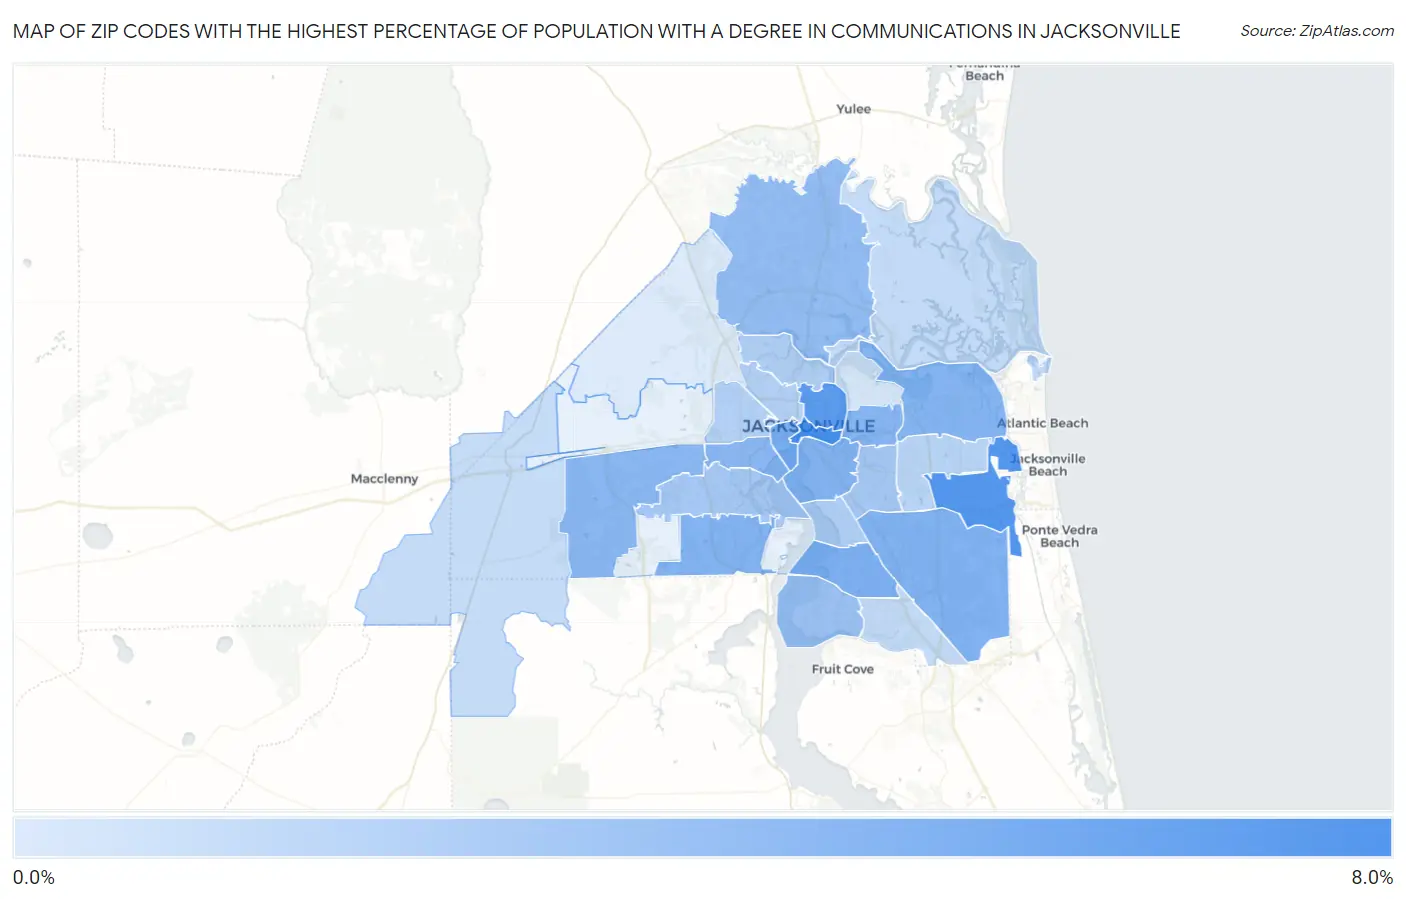
Zip Codes with the Highest Percentage of Population with a Degree in Communications in Jacksonville, FL
RELATED REPORTS & OPTIONS
Communications
Jacksonville
Compare Zip Codes
Map of Zip Codes with the Highest Percentage of Population with a Degree in Communications in Jacksonville
0.67%
8.0%
Zip Codes with the Highest Percentage of Population with a Degree in Communications in Jacksonville, FL
| Zip Code | % Graduates | vs State | vs National | |
| 1. | 32202 | 8.0% | 3.9%(+4.03)#33 | 4.1%(+3.82)#1,912 |
| 2. | 32224 | 7.3% | 3.9%(+3.35)#52 | 4.1%(+3.14)#2,372 |
| 3. | 32206 | 7.0% | 3.9%(+3.05)#61 | 4.1%(+2.84)#2,623 |
| 4. | 32204 | 5.6% | 3.9%(+1.67)#148 | 4.1%(+1.46)#4,463 |
| 5. | 32257 | 5.2% | 3.9%(+1.28)#183 | 4.1%(+1.07)#5,242 |
| 6. | 32256 | 5.1% | 3.9%(+1.15)#197 | 4.1%(+0.941)#5,516 |
| 7. | 32244 | 5.0% | 3.9%(+1.07)#206 | 4.1%(+0.856)#5,724 |
| 8. | 32207 | 5.0% | 3.9%(+1.06)#207 | 4.1%(+0.852)#5,731 |
| 9. | 32225 | 4.8% | 3.9%(+0.892)#228 | 4.1%(+0.681)#6,144 |
| 10. | 32211 | 4.8% | 3.9%(+0.882)#230 | 4.1%(+0.671)#6,174 |
| 11. | 32221 | 4.7% | 3.9%(+0.742)#247 | 4.1%(+0.531)#6,505 |
| 12. | 32205 | 4.6% | 3.9%(+0.680)#257 | 4.1%(+0.469)#6,679 |
| 13. | 32218 | 4.2% | 3.9%(+0.251)#327 | 4.1%(+0.040)#7,967 |
| 14. | 32223 | 3.8% | 3.9%(-0.076)#385 | 4.1%(-0.287)#9,093 |
| 15. | 32216 | 3.3% | 3.9%(-0.610)#473 | 4.1%(-0.821)#11,012 |
| 16. | 32210 | 3.3% | 3.9%(-0.642)#482 | 4.1%(-0.853)#11,124 |
| 17. | 32208 | 2.7% | 3.9%(-1.18)#564 | 4.1%(-1.39)#13,213 |
| 18. | 32217 | 2.7% | 3.9%(-1.20)#569 | 4.1%(-1.41)#13,324 |
| 19. | 32254 | 2.6% | 3.9%(-1.30)#596 | 4.1%(-1.51)#13,695 |
| 20. | 32209 | 2.6% | 3.9%(-1.34)#600 | 4.1%(-1.55)#13,821 |
| 21. | 32246 | 2.3% | 3.9%(-1.62)#650 | 4.1%(-1.83)#14,832 |
| 22. | 32227 | 2.0% | 3.9%(-1.93)#711 | 4.1%(-2.14)#15,926 |
| 23. | 32258 | 1.9% | 3.9%(-2.01)#726 | 4.1%(-2.22)#16,189 |
| 24. | 32226 | 1.9% | 3.9%(-2.05)#731 | 4.1%(-2.26)#16,325 |
| 25. | 32234 | 1.8% | 3.9%(-2.16)#747 | 4.1%(-2.37)#16,683 |
| 26. | 32277 | 0.98% | 3.9%(-2.94)#821 | 4.1%(-3.15)#19,032 |
| 27. | 32219 | 0.67% | 3.9%(-3.25)#834 | 4.1%(-3.46)#19,802 |
1
Common Questions
What are the Top 10 Zip Codes with the Highest Percentage of Population with a Degree in Communications in Jacksonville, FL?
Top 10 Zip Codes with the Highest Percentage of Population with a Degree in Communications in Jacksonville, FL are:
What zip code has the Highest Percentage of Population with a Degree in Communications in Jacksonville, FL?
32202 has the Highest Percentage of Population with a Degree in Communications in Jacksonville, FL with 8.0%.
What is the Percentage of Population with a Degree in Communications in Jacksonville, FL?
Percentage of Population with a Degree in Communications in Jacksonville is 4.1%.
What is the Percentage of Population with a Degree in Communications in Florida?
Percentage of Population with a Degree in Communications in Florida is 3.9%.
What is the Percentage of Population with a Degree in Communications in the United States?
Percentage of Population with a Degree in Communications in the United States is 4.1%.