Immigrants from North America vs Chickasaw Family Households
COMPARE
Immigrants from North America
Chickasaw
Family Households
Family Households Comparison
Immigrants from North America
Chickasaw
64.0%
FAMILY HOUSEHOLDS
20.0/ 100
METRIC RATING
195th/ 347
METRIC RANK
64.4%
FAMILY HOUSEHOLDS
61.5/ 100
METRIC RATING
163rd/ 347
METRIC RANK
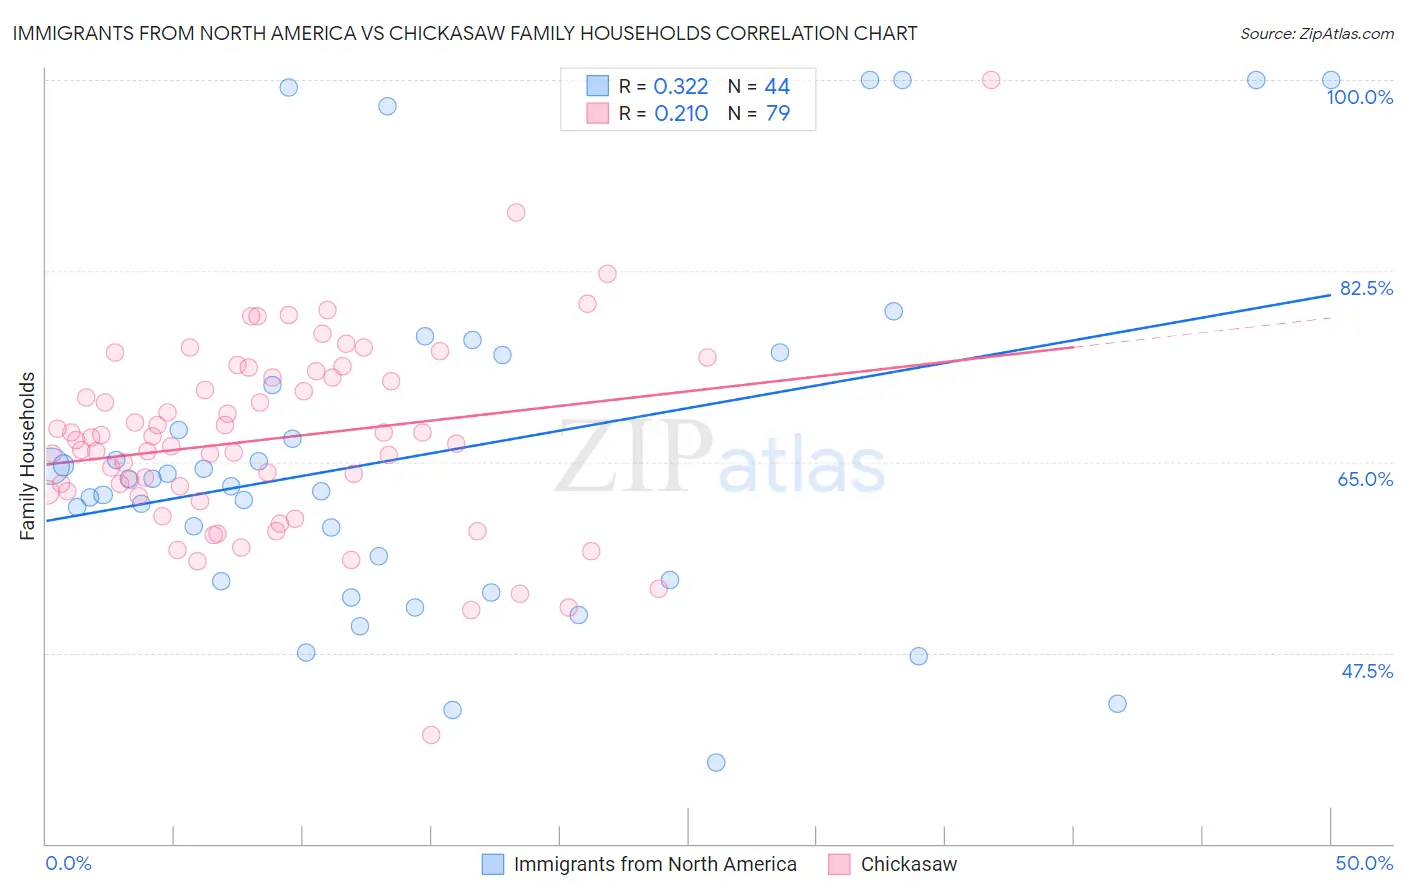
Immigrants from North America vs Chickasaw Family Households Correlation Chart
The statistical analysis conducted on geographies consisting of 462,193,298 people shows a mild positive correlation between the proportion of Immigrants from North America and percentage of family households in the United States with a correlation coefficient (R) of 0.322 and weighted average of 64.0%. Similarly, the statistical analysis conducted on geographies consisting of 147,674,365 people shows a weak positive correlation between the proportion of Chickasaw and percentage of family households in the United States with a correlation coefficient (R) of 0.210 and weighted average of 64.4%, a difference of 0.63%.
Family Households Correlation Summary
| Measurement | Immigrants from North America | Chickasaw |
| Minimum | 37.5% | 40.0% |
| Maximum | 100.0% | 100.0% |
| Range | 62.5% | 60.0% |
| Mean | 65.7% | 67.1% |
| Median | 63.1% | 67.0% |
| Interquartile 25% (IQ1) | 54.1% | 62.2% |
| Interquartile 75% (IQ3) | 73.4% | 72.8% |
| Interquartile Range (IQR) | 19.3% | 10.6% |
| Standard Deviation (Sample) | 16.4% | 8.9% |
| Standard Deviation (Population) | 16.2% | 8.8% |
Similar Demographics by Family Households
Demographics Similar to Immigrants from North America by Family Households
In terms of family households, the demographic groups most similar to Immigrants from North America are Immigrants from Canada (64.0%, a difference of 0.020%), Seminole (64.0%, a difference of 0.020%), Polish (64.0%, a difference of 0.020%), Slavic (64.0%, a difference of 0.030%), and Paiute (64.0%, a difference of 0.040%).
| Demographics | Rating | Rank | Family Households |
| Paraguayans | 26.7 /100 | #188 | Fair 64.1% |
| Immigrants | Western Asia | 25.3 /100 | #189 | Fair 64.1% |
| Zimbabweans | 24.7 /100 | #190 | Fair 64.1% |
| Arabs | 24.5 /100 | #191 | Fair 64.1% |
| Lithuanians | 23.8 /100 | #192 | Fair 64.0% |
| French | 23.7 /100 | #193 | Fair 64.0% |
| Paiute | 22.2 /100 | #194 | Fair 64.0% |
| Immigrants | North America | 20.0 /100 | #195 | Poor 64.0% |
| Immigrants | Canada | 19.2 /100 | #196 | Poor 64.0% |
| Seminole | 18.9 /100 | #197 | Poor 64.0% |
| Poles | 18.9 /100 | #198 | Poor 64.0% |
| Slavs | 18.6 /100 | #199 | Poor 64.0% |
| Immigrants | Malaysia | 17.9 /100 | #200 | Poor 64.0% |
| Immigrants | Eastern Europe | 17.2 /100 | #201 | Poor 64.0% |
| Iranians | 13.5 /100 | #202 | Poor 63.9% |
Demographics Similar to Chickasaw by Family Households
In terms of family households, the demographic groups most similar to Chickasaw are British (64.4%, a difference of 0.0%), Immigrants from England (64.4%, a difference of 0.020%), Immigrants from Nigeria (64.4%, a difference of 0.020%), Immigrants from Southern Europe (64.4%, a difference of 0.020%), and Scotch-Irish (64.4%, a difference of 0.030%).
| Demographics | Rating | Rank | Family Households |
| Czechs | 67.0 /100 | #156 | Good 64.5% |
| Canadians | 66.6 /100 | #157 | Good 64.4% |
| Lebanese | 66.4 /100 | #158 | Good 64.4% |
| Germans | 65.8 /100 | #159 | Good 64.4% |
| Immigrants | Moldova | 65.2 /100 | #160 | Good 64.4% |
| Immigrants | England | 62.6 /100 | #161 | Good 64.4% |
| British | 61.6 /100 | #162 | Good 64.4% |
| Chickasaw | 61.5 /100 | #163 | Good 64.4% |
| Immigrants | Nigeria | 60.1 /100 | #164 | Good 64.4% |
| Immigrants | Southern Europe | 60.0 /100 | #165 | Good 64.4% |
| Scotch-Irish | 59.2 /100 | #166 | Average 64.4% |
| Irish | 57.9 /100 | #167 | Average 64.4% |
| Hondurans | 57.5 /100 | #168 | Average 64.4% |
| Iraqis | 56.0 /100 | #169 | Average 64.4% |
| Armenians | 55.9 /100 | #170 | Average 64.4% |