Immigrants from North America vs Chickasaw 7th Grade
COMPARE
Immigrants from North America
Chickasaw
7th Grade
7th Grade Comparison
Immigrants from North America
Chickasaw
96.9%
7TH GRADE
99.8/ 100
METRIC RATING
62nd/ 347
METRIC RANK
96.7%
7TH GRADE
99.2/ 100
METRIC RATING
82nd/ 347
METRIC RANK
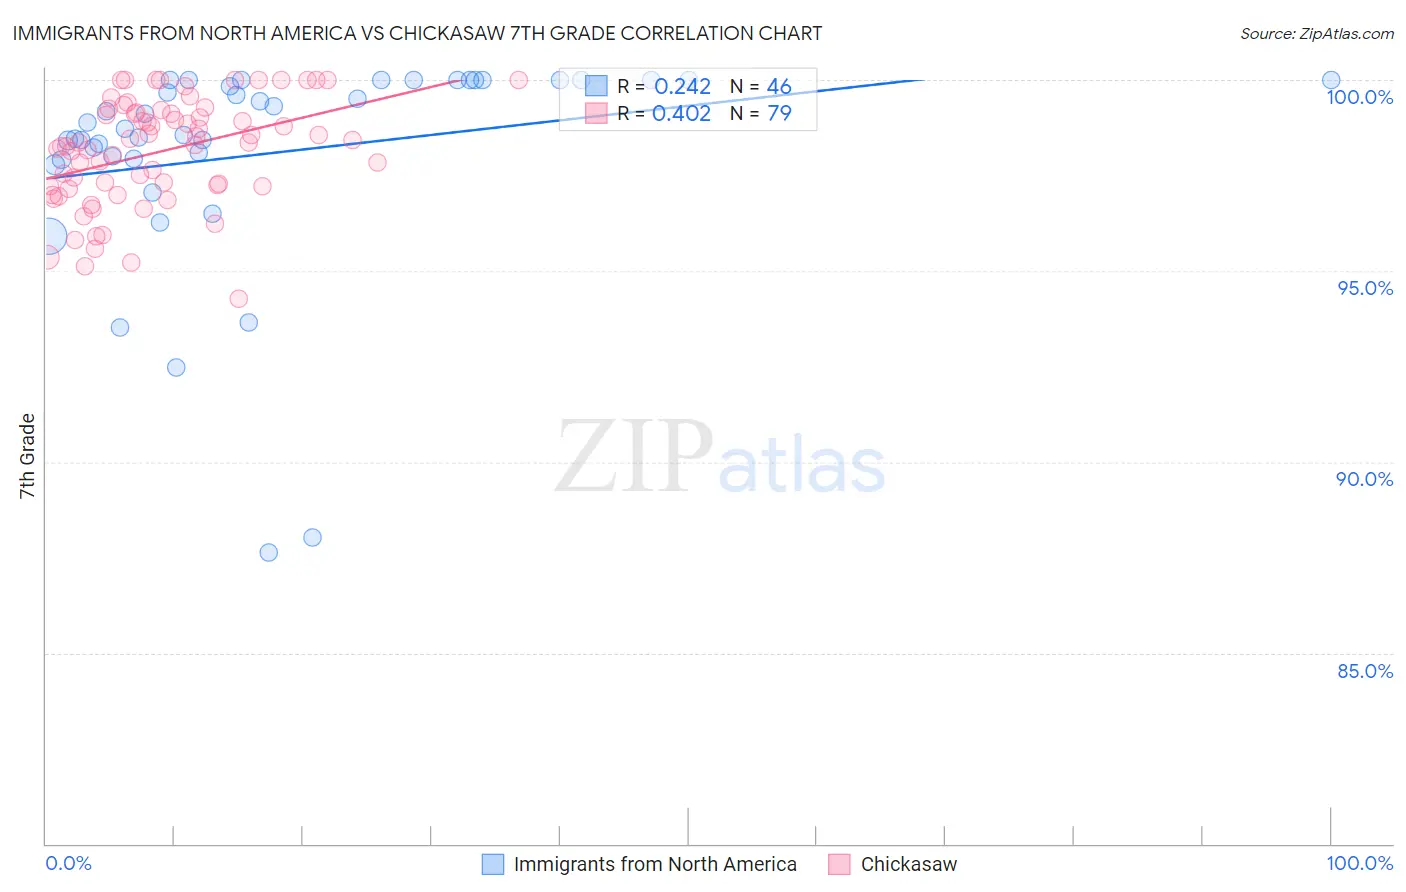
Immigrants from North America vs Chickasaw 7th Grade Correlation Chart
The statistical analysis conducted on geographies consisting of 462,462,330 people shows a weak positive correlation between the proportion of Immigrants from North America and percentage of population with at least 7th grade education in the United States with a correlation coefficient (R) of 0.242 and weighted average of 96.9%. Similarly, the statistical analysis conducted on geographies consisting of 147,726,545 people shows a moderate positive correlation between the proportion of Chickasaw and percentage of population with at least 7th grade education in the United States with a correlation coefficient (R) of 0.402 and weighted average of 96.7%, a difference of 0.19%.
7th Grade Correlation Summary
| Measurement | Immigrants from North America | Chickasaw |
| Minimum | 87.6% | 94.3% |
| Maximum | 100.0% | 100.0% |
| Range | 12.4% | 5.7% |
| Mean | 98.1% | 98.1% |
| Median | 98.8% | 98.4% |
| Interquartile 25% (IQ1) | 97.9% | 97.2% |
| Interquartile 75% (IQ3) | 100.0% | 99.1% |
| Interquartile Range (IQR) | 2.1% | 1.9% |
| Standard Deviation (Sample) | 2.8% | 1.4% |
| Standard Deviation (Population) | 2.8% | 1.4% |
Demographics Similar to Immigrants from North America and Chickasaw by 7th Grade
In terms of 7th grade, the demographic groups most similar to Immigrants from North America are Immigrants from Northern Europe (96.9%, a difference of 0.010%), Immigrants from Austria (96.9%, a difference of 0.020%), Canadian (96.9%, a difference of 0.030%), Ukrainian (96.9%, a difference of 0.040%), and Native Hawaiian (96.9%, a difference of 0.040%). Similarly, the demographic groups most similar to Chickasaw are Delaware (96.8%, a difference of 0.010%), Immigrants from Netherlands (96.8%, a difference of 0.030%), Cypriot (96.8%, a difference of 0.030%), Yugoslavian (96.8%, a difference of 0.030%), and Immigrants from Ireland (96.8%, a difference of 0.040%).
| Demographics | Rating | Rank | 7th Grade |
| Immigrants | North America | 99.8 /100 | #62 | Exceptional 96.9% |
| Immigrants | Northern Europe | 99.7 /100 | #63 | Exceptional 96.9% |
| Immigrants | Austria | 99.7 /100 | #64 | Exceptional 96.9% |
| Canadians | 99.7 /100 | #65 | Exceptional 96.9% |
| Ukrainians | 99.7 /100 | #66 | Exceptional 96.9% |
| Native Hawaiians | 99.7 /100 | #67 | Exceptional 96.9% |
| Immigrants | India | 99.6 /100 | #68 | Exceptional 96.9% |
| Iranians | 99.6 /100 | #69 | Exceptional 96.8% |
| New Zealanders | 99.6 /100 | #70 | Exceptional 96.8% |
| Immigrants | Lithuania | 99.6 /100 | #71 | Exceptional 96.8% |
| Cajuns | 99.5 /100 | #72 | Exceptional 96.8% |
| Arapaho | 99.5 /100 | #73 | Exceptional 96.8% |
| Immigrants | England | 99.5 /100 | #74 | Exceptional 96.8% |
| Zimbabweans | 99.5 /100 | #75 | Exceptional 96.8% |
| Immigrants | Ireland | 99.4 /100 | #76 | Exceptional 96.8% |
| Cherokee | 99.4 /100 | #77 | Exceptional 96.8% |
| Immigrants | Netherlands | 99.3 /100 | #78 | Exceptional 96.8% |
| Cypriots | 99.3 /100 | #79 | Exceptional 96.8% |
| Yugoslavians | 99.3 /100 | #80 | Exceptional 96.8% |
| Delaware | 99.2 /100 | #81 | Exceptional 96.8% |
| Chickasaw | 99.2 /100 | #82 | Exceptional 96.7% |