Immigrants from North America vs Immigrants from Burma/Myanmar Family Households
COMPARE
Immigrants from North America
Immigrants from Burma/Myanmar
Family Households
Family Households Comparison
Immigrants from North America
Immigrants from Burma/Myanmar
64.0%
FAMILY HOUSEHOLDS
20.0/ 100
METRIC RATING
195th/ 347
METRIC RANK
62.6%
FAMILY HOUSEHOLDS
0.0/ 100
METRIC RATING
292nd/ 347
METRIC RANK
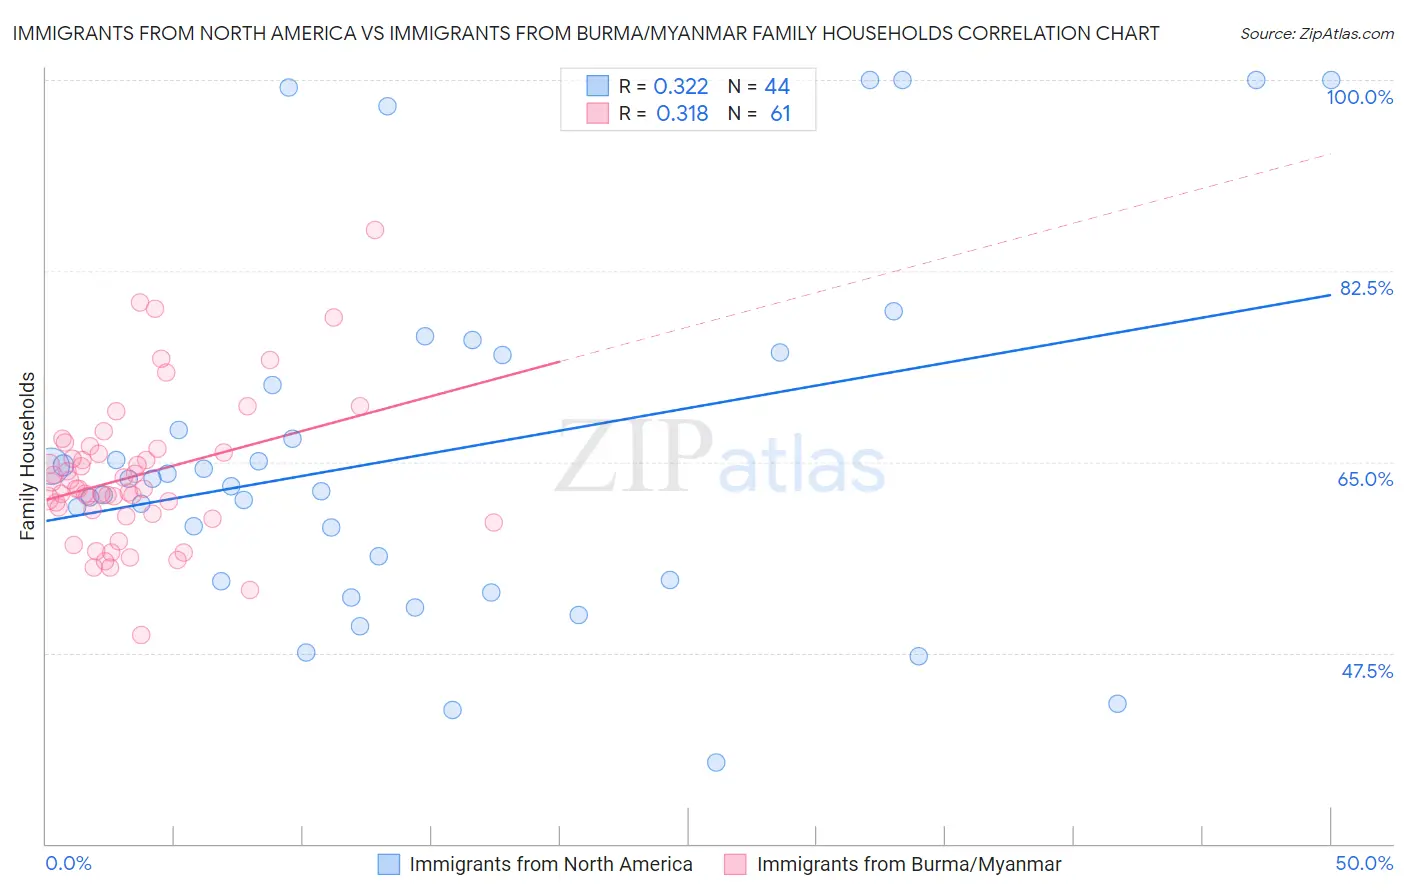
Immigrants from North America vs Immigrants from Burma/Myanmar Family Households Correlation Chart
The statistical analysis conducted on geographies consisting of 462,193,298 people shows a mild positive correlation between the proportion of Immigrants from North America and percentage of family households in the United States with a correlation coefficient (R) of 0.322 and weighted average of 64.0%. Similarly, the statistical analysis conducted on geographies consisting of 172,273,179 people shows a mild positive correlation between the proportion of Immigrants from Burma/Myanmar and percentage of family households in the United States with a correlation coefficient (R) of 0.318 and weighted average of 62.6%, a difference of 2.3%.
Family Households Correlation Summary
| Measurement | Immigrants from North America | Immigrants from Burma/Myanmar |
| Minimum | 37.5% | 49.1% |
| Maximum | 100.0% | 86.2% |
| Range | 62.5% | 37.1% |
| Mean | 65.7% | 63.7% |
| Median | 63.1% | 62.5% |
| Interquartile 25% (IQ1) | 54.1% | 60.1% |
| Interquartile 75% (IQ3) | 73.4% | 66.0% |
| Interquartile Range (IQR) | 19.3% | 5.9% |
| Standard Deviation (Sample) | 16.4% | 6.7% |
| Standard Deviation (Population) | 16.2% | 6.6% |
Similar Demographics by Family Households
Demographics Similar to Immigrants from North America by Family Households
In terms of family households, the demographic groups most similar to Immigrants from North America are Immigrants from Canada (64.0%, a difference of 0.020%), Seminole (64.0%, a difference of 0.020%), Polish (64.0%, a difference of 0.020%), Slavic (64.0%, a difference of 0.030%), and Paiute (64.0%, a difference of 0.040%).
| Demographics | Rating | Rank | Family Households |
| Paraguayans | 26.7 /100 | #188 | Fair 64.1% |
| Immigrants | Western Asia | 25.3 /100 | #189 | Fair 64.1% |
| Zimbabweans | 24.7 /100 | #190 | Fair 64.1% |
| Arabs | 24.5 /100 | #191 | Fair 64.1% |
| Lithuanians | 23.8 /100 | #192 | Fair 64.0% |
| French | 23.7 /100 | #193 | Fair 64.0% |
| Paiute | 22.2 /100 | #194 | Fair 64.0% |
| Immigrants | North America | 20.0 /100 | #195 | Poor 64.0% |
| Immigrants | Canada | 19.2 /100 | #196 | Poor 64.0% |
| Seminole | 18.9 /100 | #197 | Poor 64.0% |
| Poles | 18.9 /100 | #198 | Poor 64.0% |
| Slavs | 18.6 /100 | #199 | Poor 64.0% |
| Immigrants | Malaysia | 17.9 /100 | #200 | Poor 64.0% |
| Immigrants | Eastern Europe | 17.2 /100 | #201 | Poor 64.0% |
| Iranians | 13.5 /100 | #202 | Poor 63.9% |
Demographics Similar to Immigrants from Burma/Myanmar by Family Households
In terms of family households, the demographic groups most similar to Immigrants from Burma/Myanmar are U.S. Virgin Islander (62.6%, a difference of 0.050%), Immigrants from Grenada (62.6%, a difference of 0.10%), Immigrants from Sweden (62.5%, a difference of 0.13%), Immigrants from Nepal (62.7%, a difference of 0.18%), and Barbadian (62.5%, a difference of 0.19%).
| Demographics | Rating | Rank | Family Households |
| Mongolians | 0.1 /100 | #285 | Tragic 62.8% |
| British West Indians | 0.1 /100 | #286 | Tragic 62.8% |
| Latvians | 0.1 /100 | #287 | Tragic 62.8% |
| Immigrants | Uganda | 0.1 /100 | #288 | Tragic 62.7% |
| Immigrants | Nepal | 0.1 /100 | #289 | Tragic 62.7% |
| Immigrants | Grenada | 0.0 /100 | #290 | Tragic 62.6% |
| U.S. Virgin Islanders | 0.0 /100 | #291 | Tragic 62.6% |
| Immigrants | Burma/Myanmar | 0.0 /100 | #292 | Tragic 62.6% |
| Immigrants | Sweden | 0.0 /100 | #293 | Tragic 62.5% |
| Barbadians | 0.0 /100 | #294 | Tragic 62.5% |
| Okinawans | 0.0 /100 | #295 | Tragic 62.5% |
| Slovenes | 0.0 /100 | #296 | Tragic 62.4% |
| French American Indians | 0.0 /100 | #297 | Tragic 62.4% |
| Immigrants | Spain | 0.0 /100 | #298 | Tragic 62.4% |
| Immigrants | Kuwait | 0.0 /100 | #299 | Tragic 62.4% |