Soviet Union vs Chickasaw Family Households
COMPARE
Soviet Union
Chickasaw
Family Households
Family Households Comparison
Soviet Union
Chickasaw
60.9%
FAMILY HOUSEHOLDS
0.0/ 100
METRIC RATING
337th/ 347
METRIC RANK
64.4%
FAMILY HOUSEHOLDS
61.5/ 100
METRIC RATING
163rd/ 347
METRIC RANK
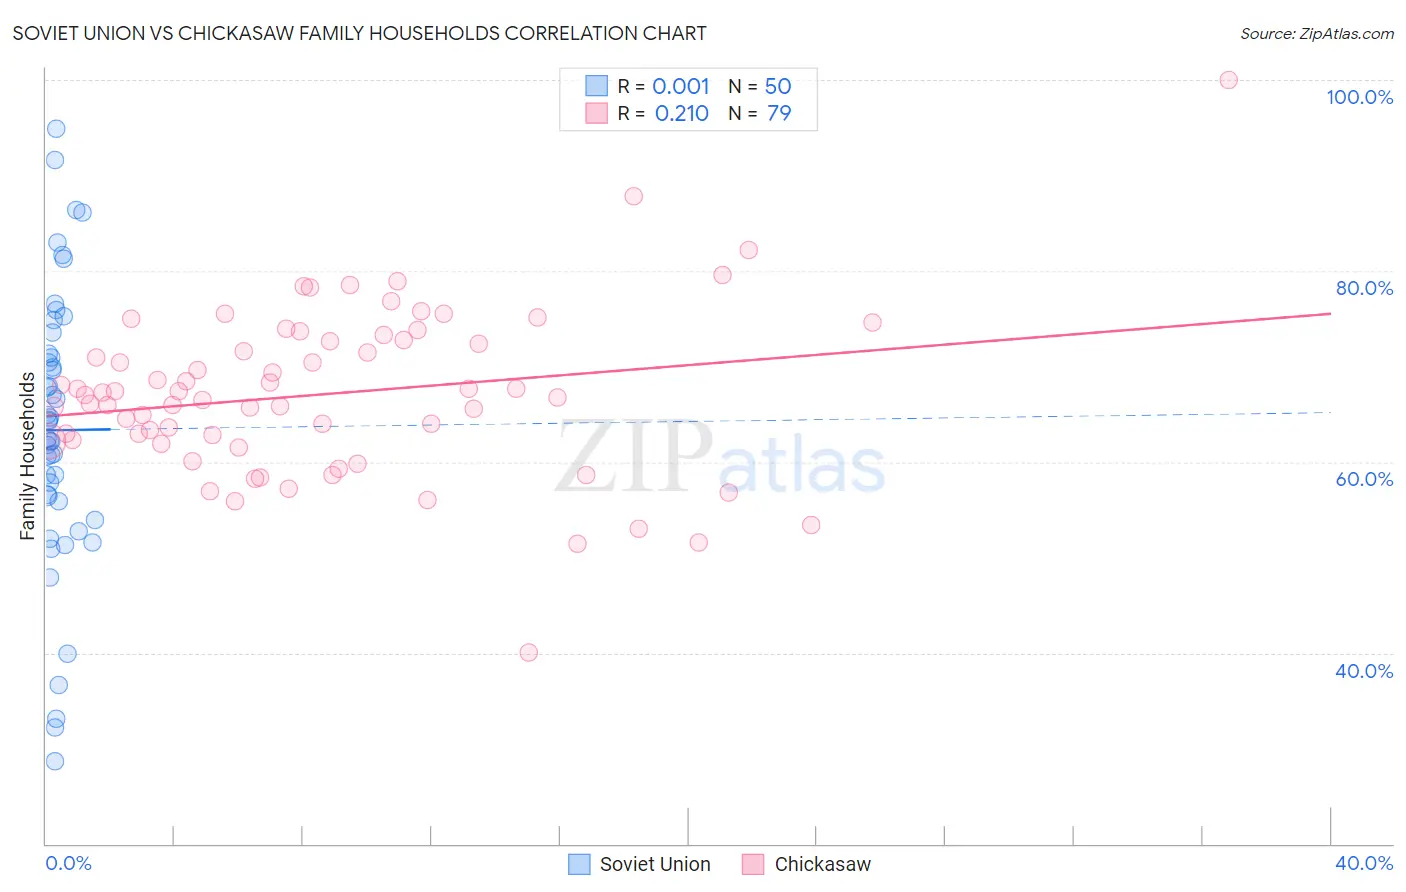
Soviet Union vs Chickasaw Family Households Correlation Chart
The statistical analysis conducted on geographies consisting of 43,509,630 people shows no correlation between the proportion of Soviet Union and percentage of family households in the United States with a correlation coefficient (R) of 0.001 and weighted average of 60.9%. Similarly, the statistical analysis conducted on geographies consisting of 147,674,365 people shows a weak positive correlation between the proportion of Chickasaw and percentage of family households in the United States with a correlation coefficient (R) of 0.210 and weighted average of 64.4%, a difference of 5.7%.
Family Households Correlation Summary
| Measurement | Soviet Union | Chickasaw |
| Minimum | 28.6% | 40.0% |
| Maximum | 94.9% | 100.0% |
| Range | 66.3% | 60.0% |
| Mean | 63.3% | 67.1% |
| Median | 63.3% | 67.0% |
| Interquartile 25% (IQ1) | 55.8% | 62.2% |
| Interquartile 75% (IQ3) | 71.4% | 72.8% |
| Interquartile Range (IQR) | 15.5% | 10.6% |
| Standard Deviation (Sample) | 14.7% | 8.9% |
| Standard Deviation (Population) | 14.5% | 8.8% |
Similar Demographics by Family Households
Demographics Similar to Soviet Union by Family Households
In terms of family households, the demographic groups most similar to Soviet Union are German Russian (60.9%, a difference of 0.0%), Immigrants from Eritrea (60.8%, a difference of 0.14%), Carpatho Rusyn (61.1%, a difference of 0.28%), Immigrants from Saudi Arabia (60.7%, a difference of 0.34%), and Immigrants from Eastern Africa (61.1%, a difference of 0.40%).
| Demographics | Rating | Rank | Family Households |
| Immigrants | Australia | 0.0 /100 | #330 | Tragic 61.3% |
| Immigrants | France | 0.0 /100 | #331 | Tragic 61.3% |
| Ethiopians | 0.0 /100 | #332 | Tragic 61.2% |
| Immigrants | Ethiopia | 0.0 /100 | #333 | Tragic 61.2% |
| Immigrants | Eastern Africa | 0.0 /100 | #334 | Tragic 61.1% |
| Carpatho Rusyns | 0.0 /100 | #335 | Tragic 61.1% |
| German Russians | 0.0 /100 | #336 | Tragic 60.9% |
| Soviet Union | 0.0 /100 | #337 | Tragic 60.9% |
| Immigrants | Eritrea | 0.0 /100 | #338 | Tragic 60.8% |
| Immigrants | Saudi Arabia | 0.0 /100 | #339 | Tragic 60.7% |
| Immigrants | Sudan | 0.0 /100 | #340 | Tragic 60.2% |
| Immigrants | Senegal | 0.0 /100 | #341 | Tragic 60.1% |
| Sudanese | 0.0 /100 | #342 | Tragic 60.0% |
| Senegalese | 0.0 /100 | #343 | Tragic 59.8% |
| Immigrants | Congo | 0.0 /100 | #344 | Tragic 59.2% |
Demographics Similar to Chickasaw by Family Households
In terms of family households, the demographic groups most similar to Chickasaw are British (64.4%, a difference of 0.0%), Immigrants from England (64.4%, a difference of 0.020%), Immigrants from Nigeria (64.4%, a difference of 0.020%), Immigrants from Southern Europe (64.4%, a difference of 0.020%), and Scotch-Irish (64.4%, a difference of 0.030%).
| Demographics | Rating | Rank | Family Households |
| Czechs | 67.0 /100 | #156 | Good 64.5% |
| Canadians | 66.6 /100 | #157 | Good 64.4% |
| Lebanese | 66.4 /100 | #158 | Good 64.4% |
| Germans | 65.8 /100 | #159 | Good 64.4% |
| Immigrants | Moldova | 65.2 /100 | #160 | Good 64.4% |
| Immigrants | England | 62.6 /100 | #161 | Good 64.4% |
| British | 61.6 /100 | #162 | Good 64.4% |
| Chickasaw | 61.5 /100 | #163 | Good 64.4% |
| Immigrants | Nigeria | 60.1 /100 | #164 | Good 64.4% |
| Immigrants | Southern Europe | 60.0 /100 | #165 | Good 64.4% |
| Scotch-Irish | 59.2 /100 | #166 | Average 64.4% |
| Irish | 57.9 /100 | #167 | Average 64.4% |
| Hondurans | 57.5 /100 | #168 | Average 64.4% |
| Iraqis | 56.0 /100 | #169 | Average 64.4% |
| Armenians | 55.9 /100 | #170 | Average 64.4% |