Immigrants from Taiwan vs Chickasaw Family Households
COMPARE
Immigrants from Taiwan
Chickasaw
Family Households
Family Households Comparison
Immigrants from Taiwan
Chickasaw
68.0%
FAMILY HOUSEHOLDS
100.0/ 100
METRIC RATING
18th/ 347
METRIC RANK
64.4%
FAMILY HOUSEHOLDS
61.5/ 100
METRIC RATING
163rd/ 347
METRIC RANK
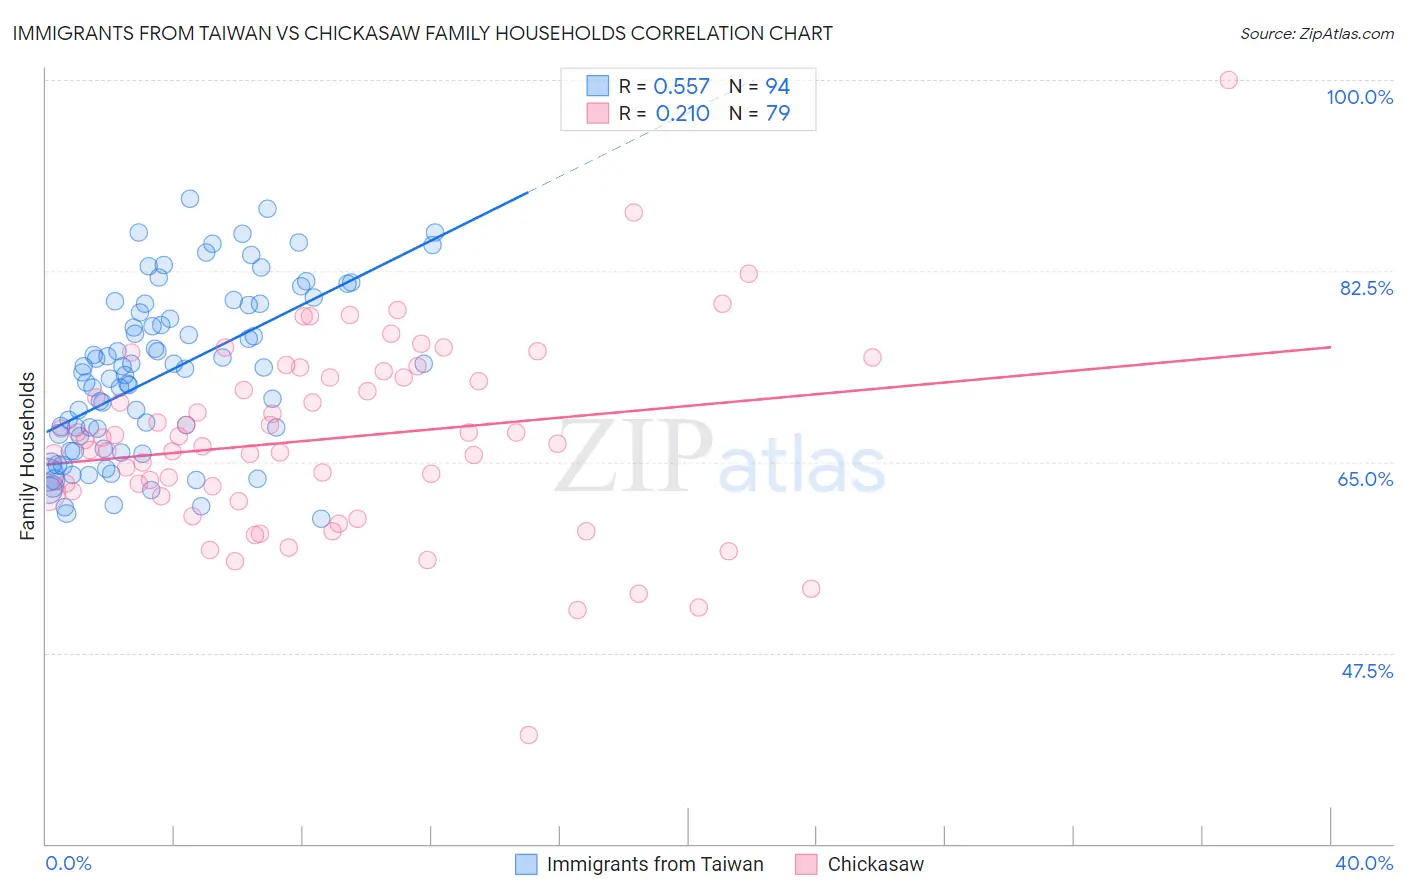
Immigrants from Taiwan vs Chickasaw Family Households Correlation Chart
The statistical analysis conducted on geographies consisting of 298,121,078 people shows a substantial positive correlation between the proportion of Immigrants from Taiwan and percentage of family households in the United States with a correlation coefficient (R) of 0.557 and weighted average of 68.0%. Similarly, the statistical analysis conducted on geographies consisting of 147,674,365 people shows a weak positive correlation between the proportion of Chickasaw and percentage of family households in the United States with a correlation coefficient (R) of 0.210 and weighted average of 64.4%, a difference of 5.6%.
Family Households Correlation Summary
| Measurement | Immigrants from Taiwan | Chickasaw |
| Minimum | 59.8% | 40.0% |
| Maximum | 89.1% | 100.0% |
| Range | 29.3% | 60.0% |
| Mean | 73.0% | 67.1% |
| Median | 73.4% | 67.0% |
| Interquartile 25% (IQ1) | 66.3% | 62.2% |
| Interquartile 75% (IQ3) | 79.4% | 72.8% |
| Interquartile Range (IQR) | 13.2% | 10.6% |
| Standard Deviation (Sample) | 7.6% | 8.9% |
| Standard Deviation (Population) | 7.5% | 8.8% |
Similar Demographics by Family Households
Demographics Similar to Immigrants from Taiwan by Family Households
In terms of family households, the demographic groups most similar to Immigrants from Taiwan are Samoan (67.9%, a difference of 0.12%), Chinese (68.1%, a difference of 0.16%), Immigrants from Vietnam (68.2%, a difference of 0.19%), Assyrian/Chaldean/Syriac (68.2%, a difference of 0.20%), and Pueblo (68.2%, a difference of 0.26%).
| Demographics | Rating | Rank | Family Households |
| Immigrants | Central America | 100.0 /100 | #11 | Exceptional 68.3% |
| Koreans | 100.0 /100 | #12 | Exceptional 68.3% |
| Pueblo | 100.0 /100 | #13 | Exceptional 68.2% |
| Immigrants | Cuba | 100.0 /100 | #14 | Exceptional 68.2% |
| Assyrians/Chaldeans/Syriacs | 100.0 /100 | #15 | Exceptional 68.2% |
| Immigrants | Vietnam | 100.0 /100 | #16 | Exceptional 68.2% |
| Chinese | 100.0 /100 | #17 | Exceptional 68.1% |
| Immigrants | Taiwan | 100.0 /100 | #18 | Exceptional 68.0% |
| Samoans | 100.0 /100 | #19 | Exceptional 67.9% |
| Inupiat | 100.0 /100 | #20 | Exceptional 67.8% |
| Cubans | 100.0 /100 | #21 | Exceptional 67.7% |
| Sri Lankans | 100.0 /100 | #22 | Exceptional 67.7% |
| Immigrants | Pakistan | 100.0 /100 | #23 | Exceptional 67.7% |
| Immigrants | South Eastern Asia | 100.0 /100 | #24 | Exceptional 67.5% |
| Immigrants | Nicaragua | 100.0 /100 | #25 | Exceptional 67.5% |
Demographics Similar to Chickasaw by Family Households
In terms of family households, the demographic groups most similar to Chickasaw are British (64.4%, a difference of 0.0%), Immigrants from England (64.4%, a difference of 0.020%), Immigrants from Nigeria (64.4%, a difference of 0.020%), Immigrants from Southern Europe (64.4%, a difference of 0.020%), and Scotch-Irish (64.4%, a difference of 0.030%).
| Demographics | Rating | Rank | Family Households |
| Czechs | 67.0 /100 | #156 | Good 64.5% |
| Canadians | 66.6 /100 | #157 | Good 64.4% |
| Lebanese | 66.4 /100 | #158 | Good 64.4% |
| Germans | 65.8 /100 | #159 | Good 64.4% |
| Immigrants | Moldova | 65.2 /100 | #160 | Good 64.4% |
| Immigrants | England | 62.6 /100 | #161 | Good 64.4% |
| British | 61.6 /100 | #162 | Good 64.4% |
| Chickasaw | 61.5 /100 | #163 | Good 64.4% |
| Immigrants | Nigeria | 60.1 /100 | #164 | Good 64.4% |
| Immigrants | Southern Europe | 60.0 /100 | #165 | Good 64.4% |
| Scotch-Irish | 59.2 /100 | #166 | Average 64.4% |
| Irish | 57.9 /100 | #167 | Average 64.4% |
| Hondurans | 57.5 /100 | #168 | Average 64.4% |
| Iraqis | 56.0 /100 | #169 | Average 64.4% |
| Armenians | 55.9 /100 | #170 | Average 64.4% |