Immigrants from Nigeria vs Chickasaw Family Households
COMPARE
Immigrants from Nigeria
Chickasaw
Family Households
Family Households Comparison
Immigrants from Nigeria
Chickasaw
64.4%
FAMILY HOUSEHOLDS
60.1/ 100
METRIC RATING
164th/ 347
METRIC RANK
64.4%
FAMILY HOUSEHOLDS
61.5/ 100
METRIC RATING
163rd/ 347
METRIC RANK
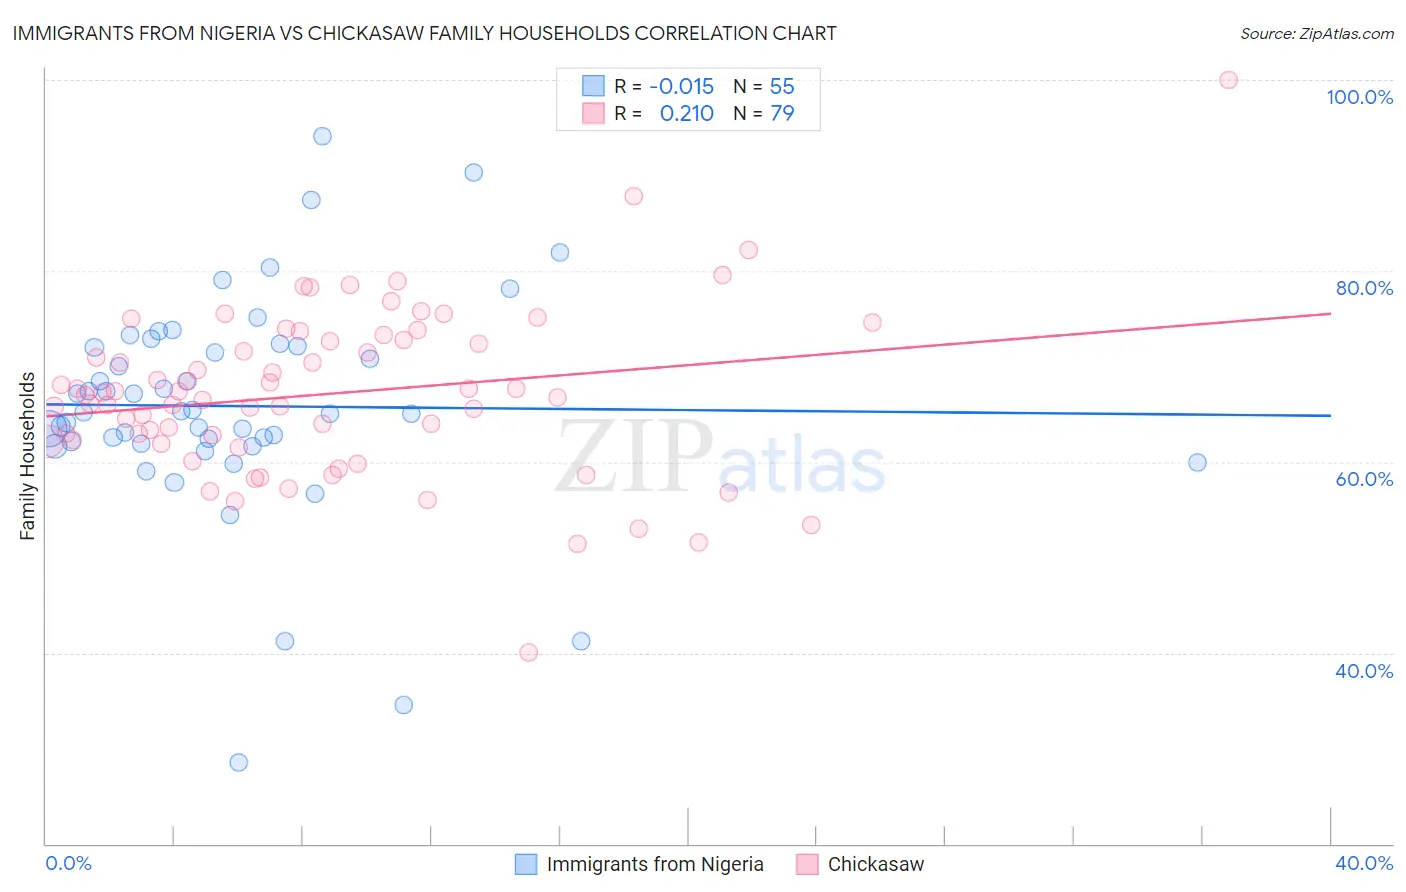
Immigrants from Nigeria vs Chickasaw Family Households Correlation Chart
The statistical analysis conducted on geographies consisting of 283,303,761 people shows no correlation between the proportion of Immigrants from Nigeria and percentage of family households in the United States with a correlation coefficient (R) of -0.015 and weighted average of 64.4%. Similarly, the statistical analysis conducted on geographies consisting of 147,674,365 people shows a weak positive correlation between the proportion of Chickasaw and percentage of family households in the United States with a correlation coefficient (R) of 0.210 and weighted average of 64.4%, a difference of 0.020%.
Family Households Correlation Summary
| Measurement | Immigrants from Nigeria | Chickasaw |
| Minimum | 28.6% | 40.0% |
| Maximum | 94.1% | 100.0% |
| Range | 65.6% | 60.0% |
| Mean | 65.9% | 67.1% |
| Median | 65.1% | 67.0% |
| Interquartile 25% (IQ1) | 61.8% | 62.2% |
| Interquartile 75% (IQ3) | 72.1% | 72.8% |
| Interquartile Range (IQR) | 10.2% | 10.6% |
| Standard Deviation (Sample) | 11.7% | 8.9% |
| Standard Deviation (Population) | 11.6% | 8.8% |
Demographics Similar to Immigrants from Nigeria and Chickasaw by Family Households
In terms of family households, the demographic groups most similar to Immigrants from Nigeria are Immigrants from Southern Europe (64.4%, a difference of 0.0%), Scotch-Irish (64.4%, a difference of 0.010%), British (64.4%, a difference of 0.020%), Irish (64.4%, a difference of 0.030%), and Immigrants from England (64.4%, a difference of 0.040%). Similarly, the demographic groups most similar to Chickasaw are British (64.4%, a difference of 0.0%), Immigrants from England (64.4%, a difference of 0.020%), Immigrants from Southern Europe (64.4%, a difference of 0.020%), Scotch-Irish (64.4%, a difference of 0.030%), and Immigrants from Moldova (64.4%, a difference of 0.050%).
| Demographics | Rating | Rank | Family Households |
| Swedes | 69.8 /100 | #153 | Good 64.5% |
| Austrians | 68.5 /100 | #154 | Good 64.5% |
| Uruguayans | 67.7 /100 | #155 | Good 64.5% |
| Czechs | 67.0 /100 | #156 | Good 64.5% |
| Canadians | 66.6 /100 | #157 | Good 64.4% |
| Lebanese | 66.4 /100 | #158 | Good 64.4% |
| Germans | 65.8 /100 | #159 | Good 64.4% |
| Immigrants | Moldova | 65.2 /100 | #160 | Good 64.4% |
| Immigrants | England | 62.6 /100 | #161 | Good 64.4% |
| British | 61.6 /100 | #162 | Good 64.4% |
| Chickasaw | 61.5 /100 | #163 | Good 64.4% |
| Immigrants | Nigeria | 60.1 /100 | #164 | Good 64.4% |
| Immigrants | Southern Europe | 60.0 /100 | #165 | Good 64.4% |
| Scotch-Irish | 59.2 /100 | #166 | Average 64.4% |
| Irish | 57.9 /100 | #167 | Average 64.4% |
| Hondurans | 57.5 /100 | #168 | Average 64.4% |
| Iraqis | 56.0 /100 | #169 | Average 64.4% |
| Armenians | 55.9 /100 | #170 | Average 64.4% |
| Ute | 54.6 /100 | #171 | Average 64.3% |
| Dutch West Indians | 53.9 /100 | #172 | Average 64.3% |
| Immigrants | Sierra Leone | 52.5 /100 | #173 | Average 64.3% |