Immigrants from Nigeria vs Immigrants from Western Africa Family Households
COMPARE
Immigrants from Nigeria
Immigrants from Western Africa
Family Households
Family Households Comparison
Immigrants from Nigeria
Immigrants from Western Africa
64.4%
FAMILY HOUSEHOLDS
60.1/ 100
METRIC RATING
164th/ 347
METRIC RANK
63.1%
FAMILY HOUSEHOLDS
0.5/ 100
METRIC RATING
266th/ 347
METRIC RANK
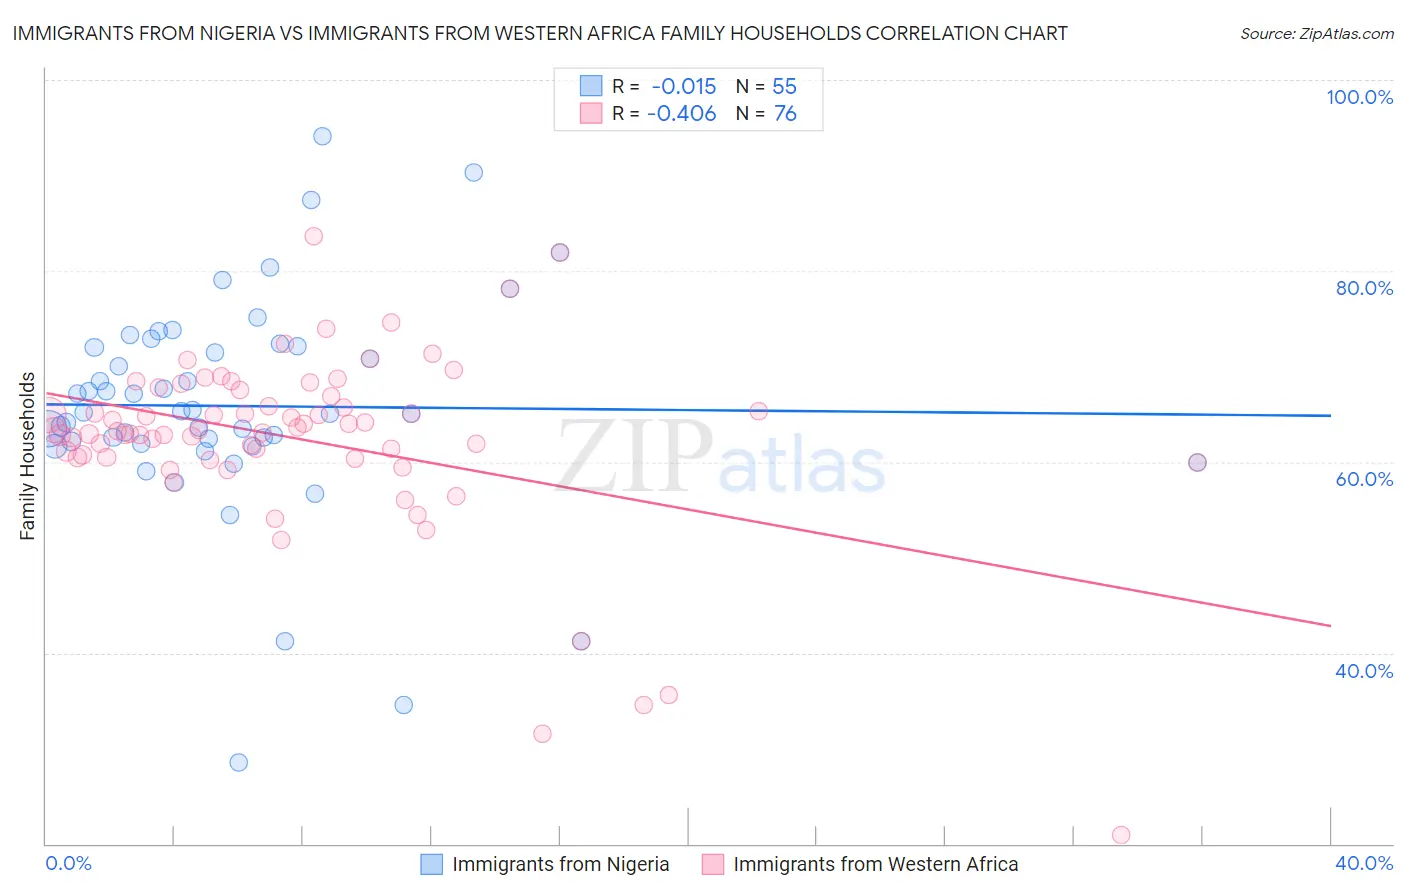
Immigrants from Nigeria vs Immigrants from Western Africa Family Households Correlation Chart
The statistical analysis conducted on geographies consisting of 283,303,761 people shows no correlation between the proportion of Immigrants from Nigeria and percentage of family households in the United States with a correlation coefficient (R) of -0.015 and weighted average of 64.4%. Similarly, the statistical analysis conducted on geographies consisting of 357,554,747 people shows a moderate negative correlation between the proportion of Immigrants from Western Africa and percentage of family households in the United States with a correlation coefficient (R) of -0.406 and weighted average of 63.1%, a difference of 2.0%.
Family Households Correlation Summary
| Measurement | Immigrants from Nigeria | Immigrants from Western Africa |
| Minimum | 28.6% | 20.9% |
| Maximum | 94.1% | 83.6% |
| Range | 65.6% | 62.7% |
| Mean | 65.9% | 62.4% |
| Median | 65.1% | 63.3% |
| Interquartile 25% (IQ1) | 61.8% | 60.5% |
| Interquartile 75% (IQ3) | 72.1% | 67.2% |
| Interquartile Range (IQR) | 10.2% | 6.7% |
| Standard Deviation (Sample) | 11.7% | 9.9% |
| Standard Deviation (Population) | 11.6% | 9.8% |
Similar Demographics by Family Households
Demographics Similar to Immigrants from Nigeria by Family Households
In terms of family households, the demographic groups most similar to Immigrants from Nigeria are Immigrants from Southern Europe (64.4%, a difference of 0.0%), Scotch-Irish (64.4%, a difference of 0.010%), British (64.4%, a difference of 0.020%), Chickasaw (64.4%, a difference of 0.020%), and Irish (64.4%, a difference of 0.030%).
| Demographics | Rating | Rank | Family Households |
| Canadians | 66.6 /100 | #157 | Good 64.4% |
| Lebanese | 66.4 /100 | #158 | Good 64.4% |
| Germans | 65.8 /100 | #159 | Good 64.4% |
| Immigrants | Moldova | 65.2 /100 | #160 | Good 64.4% |
| Immigrants | England | 62.6 /100 | #161 | Good 64.4% |
| British | 61.6 /100 | #162 | Good 64.4% |
| Chickasaw | 61.5 /100 | #163 | Good 64.4% |
| Immigrants | Nigeria | 60.1 /100 | #164 | Good 64.4% |
| Immigrants | Southern Europe | 60.0 /100 | #165 | Good 64.4% |
| Scotch-Irish | 59.2 /100 | #166 | Average 64.4% |
| Irish | 57.9 /100 | #167 | Average 64.4% |
| Hondurans | 57.5 /100 | #168 | Average 64.4% |
| Iraqis | 56.0 /100 | #169 | Average 64.4% |
| Armenians | 55.9 /100 | #170 | Average 64.4% |
| Ute | 54.6 /100 | #171 | Average 64.3% |
Demographics Similar to Immigrants from Western Africa by Family Households
In terms of family households, the demographic groups most similar to Immigrants from Western Africa are Colville (63.2%, a difference of 0.010%), Cheyenne (63.2%, a difference of 0.020%), Kenyan (63.2%, a difference of 0.020%), Israeli (63.1%, a difference of 0.040%), and Immigrants from Ireland (63.2%, a difference of 0.050%).
| Demographics | Rating | Rank | Family Households |
| Immigrants | Western Europe | 0.6 /100 | #259 | Tragic 63.2% |
| Cypriots | 0.6 /100 | #260 | Tragic 63.2% |
| Immigrants | Russia | 0.6 /100 | #261 | Tragic 63.2% |
| Immigrants | Ireland | 0.6 /100 | #262 | Tragic 63.2% |
| Cheyenne | 0.5 /100 | #263 | Tragic 63.2% |
| Kenyans | 0.5 /100 | #264 | Tragic 63.2% |
| Colville | 0.5 /100 | #265 | Tragic 63.2% |
| Immigrants | Western Africa | 0.5 /100 | #266 | Tragic 63.1% |
| Israelis | 0.4 /100 | #267 | Tragic 63.1% |
| Immigrants | Singapore | 0.4 /100 | #268 | Tragic 63.1% |
| Yugoslavians | 0.4 /100 | #269 | Tragic 63.1% |
| Immigrants | Austria | 0.3 /100 | #270 | Tragic 63.1% |
| Immigrants | Croatia | 0.3 /100 | #271 | Tragic 63.1% |
| Immigrants | Turkey | 0.3 /100 | #272 | Tragic 63.1% |
| Immigrants | Kazakhstan | 0.3 /100 | #273 | Tragic 63.1% |