Immigrants from Nigeria vs Indonesian Family Households
COMPARE
Immigrants from Nigeria
Indonesian
Family Households
Family Households Comparison
Immigrants from Nigeria
Indonesians
64.4%
FAMILY HOUSEHOLDS
60.1/ 100
METRIC RATING
164th/ 347
METRIC RANK
61.5%
FAMILY HOUSEHOLDS
0.0/ 100
METRIC RATING
326th/ 347
METRIC RANK
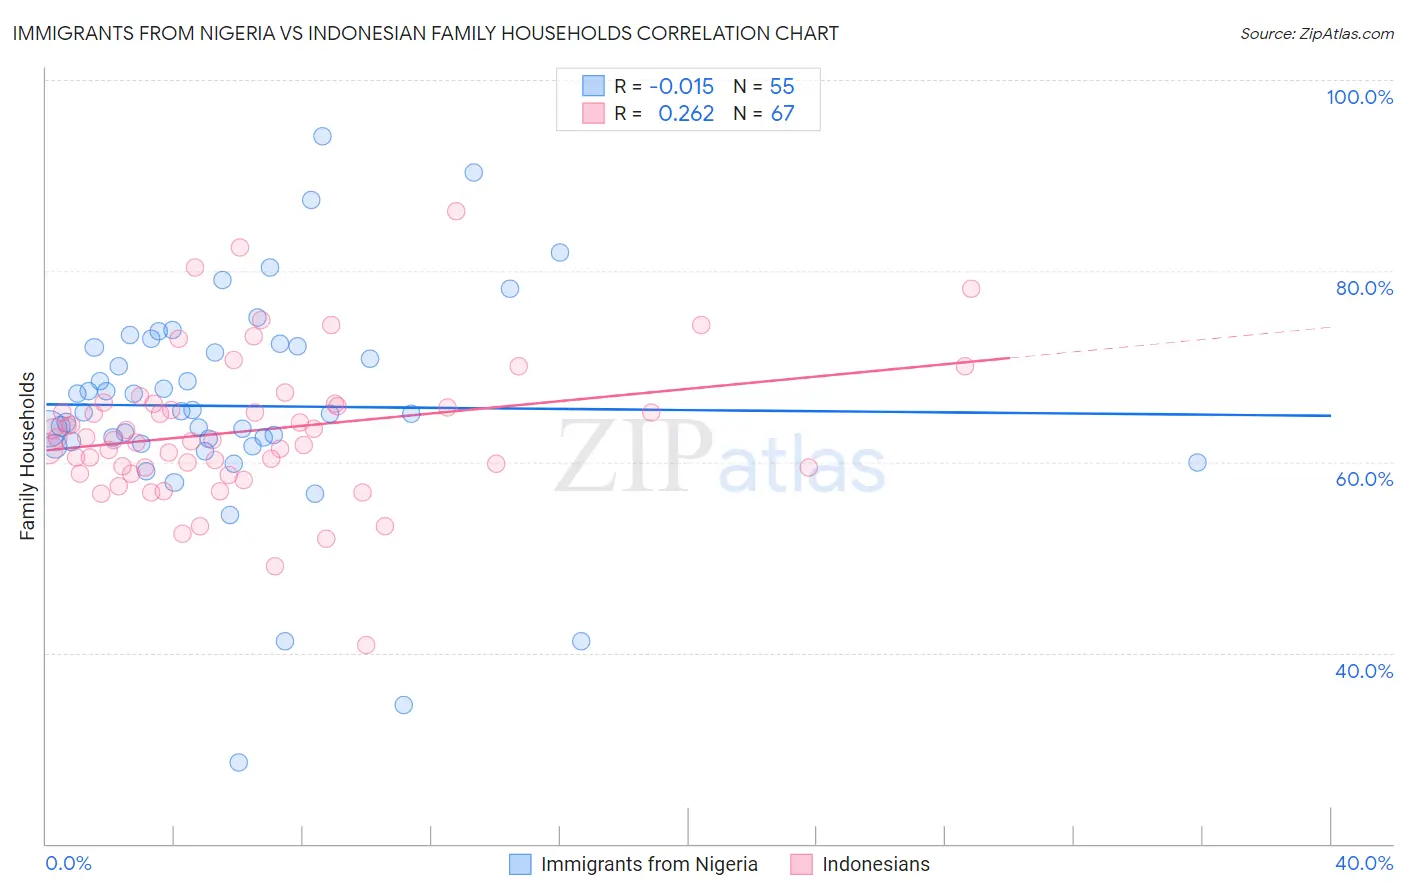
Immigrants from Nigeria vs Indonesian Family Households Correlation Chart
The statistical analysis conducted on geographies consisting of 283,303,761 people shows no correlation between the proportion of Immigrants from Nigeria and percentage of family households in the United States with a correlation coefficient (R) of -0.015 and weighted average of 64.4%. Similarly, the statistical analysis conducted on geographies consisting of 162,647,758 people shows a weak positive correlation between the proportion of Indonesians and percentage of family households in the United States with a correlation coefficient (R) of 0.262 and weighted average of 61.5%, a difference of 4.7%.
Family Households Correlation Summary
| Measurement | Immigrants from Nigeria | Indonesian |
| Minimum | 28.6% | 40.9% |
| Maximum | 94.1% | 86.2% |
| Range | 65.6% | 45.3% |
| Mean | 65.9% | 63.3% |
| Median | 65.1% | 62.3% |
| Interquartile 25% (IQ1) | 61.8% | 59.4% |
| Interquartile 75% (IQ3) | 72.1% | 66.1% |
| Interquartile Range (IQR) | 10.2% | 6.7% |
| Standard Deviation (Sample) | 11.7% | 7.6% |
| Standard Deviation (Population) | 11.6% | 7.6% |
Similar Demographics by Family Households
Demographics Similar to Immigrants from Nigeria by Family Households
In terms of family households, the demographic groups most similar to Immigrants from Nigeria are Immigrants from Southern Europe (64.4%, a difference of 0.0%), Scotch-Irish (64.4%, a difference of 0.010%), British (64.4%, a difference of 0.020%), Chickasaw (64.4%, a difference of 0.020%), and Irish (64.4%, a difference of 0.030%).
| Demographics | Rating | Rank | Family Households |
| Canadians | 66.6 /100 | #157 | Good 64.4% |
| Lebanese | 66.4 /100 | #158 | Good 64.4% |
| Germans | 65.8 /100 | #159 | Good 64.4% |
| Immigrants | Moldova | 65.2 /100 | #160 | Good 64.4% |
| Immigrants | England | 62.6 /100 | #161 | Good 64.4% |
| British | 61.6 /100 | #162 | Good 64.4% |
| Chickasaw | 61.5 /100 | #163 | Good 64.4% |
| Immigrants | Nigeria | 60.1 /100 | #164 | Good 64.4% |
| Immigrants | Southern Europe | 60.0 /100 | #165 | Good 64.4% |
| Scotch-Irish | 59.2 /100 | #166 | Average 64.4% |
| Irish | 57.9 /100 | #167 | Average 64.4% |
| Hondurans | 57.5 /100 | #168 | Average 64.4% |
| Iraqis | 56.0 /100 | #169 | Average 64.4% |
| Armenians | 55.9 /100 | #170 | Average 64.4% |
| Ute | 54.6 /100 | #171 | Average 64.3% |
Demographics Similar to Indonesians by Family Households
In terms of family households, the demographic groups most similar to Indonesians are Black/African American (61.5%, a difference of 0.020%), Kiowa (61.4%, a difference of 0.15%), Cambodian (61.4%, a difference of 0.18%), Immigrants from Switzerland (61.6%, a difference of 0.19%), and Immigrants from West Indies (61.6%, a difference of 0.20%).
| Demographics | Rating | Rank | Family Households |
| Cape Verdeans | 0.0 /100 | #319 | Tragic 61.8% |
| Ugandans | 0.0 /100 | #320 | Tragic 61.7% |
| Alsatians | 0.0 /100 | #321 | Tragic 61.7% |
| Immigrants | Serbia | 0.0 /100 | #322 | Tragic 61.6% |
| Tlingit-Haida | 0.0 /100 | #323 | Tragic 61.6% |
| Immigrants | West Indies | 0.0 /100 | #324 | Tragic 61.6% |
| Immigrants | Switzerland | 0.0 /100 | #325 | Tragic 61.6% |
| Indonesians | 0.0 /100 | #326 | Tragic 61.5% |
| Blacks/African Americans | 0.0 /100 | #327 | Tragic 61.5% |
| Kiowa | 0.0 /100 | #328 | Tragic 61.4% |
| Cambodians | 0.0 /100 | #329 | Tragic 61.4% |
| Immigrants | Australia | 0.0 /100 | #330 | Tragic 61.3% |
| Immigrants | France | 0.0 /100 | #331 | Tragic 61.3% |
| Ethiopians | 0.0 /100 | #332 | Tragic 61.2% |
| Immigrants | Ethiopia | 0.0 /100 | #333 | Tragic 61.2% |