Immigrants from Nigeria vs Chickasaw Married-Couple Family Poverty
COMPARE
Immigrants from Nigeria
Chickasaw
Married-Couple Family Poverty
Married-Couple Family Poverty Comparison
Immigrants from Nigeria
Chickasaw
5.5%
MARRIED-COUPLE FAMILY POVERTY
11.3/ 100
METRIC RATING
217th/ 347
METRIC RANK
5.8%
MARRIED-COUPLE FAMILY POVERTY
2.3/ 100
METRIC RATING
244th/ 347
METRIC RANK
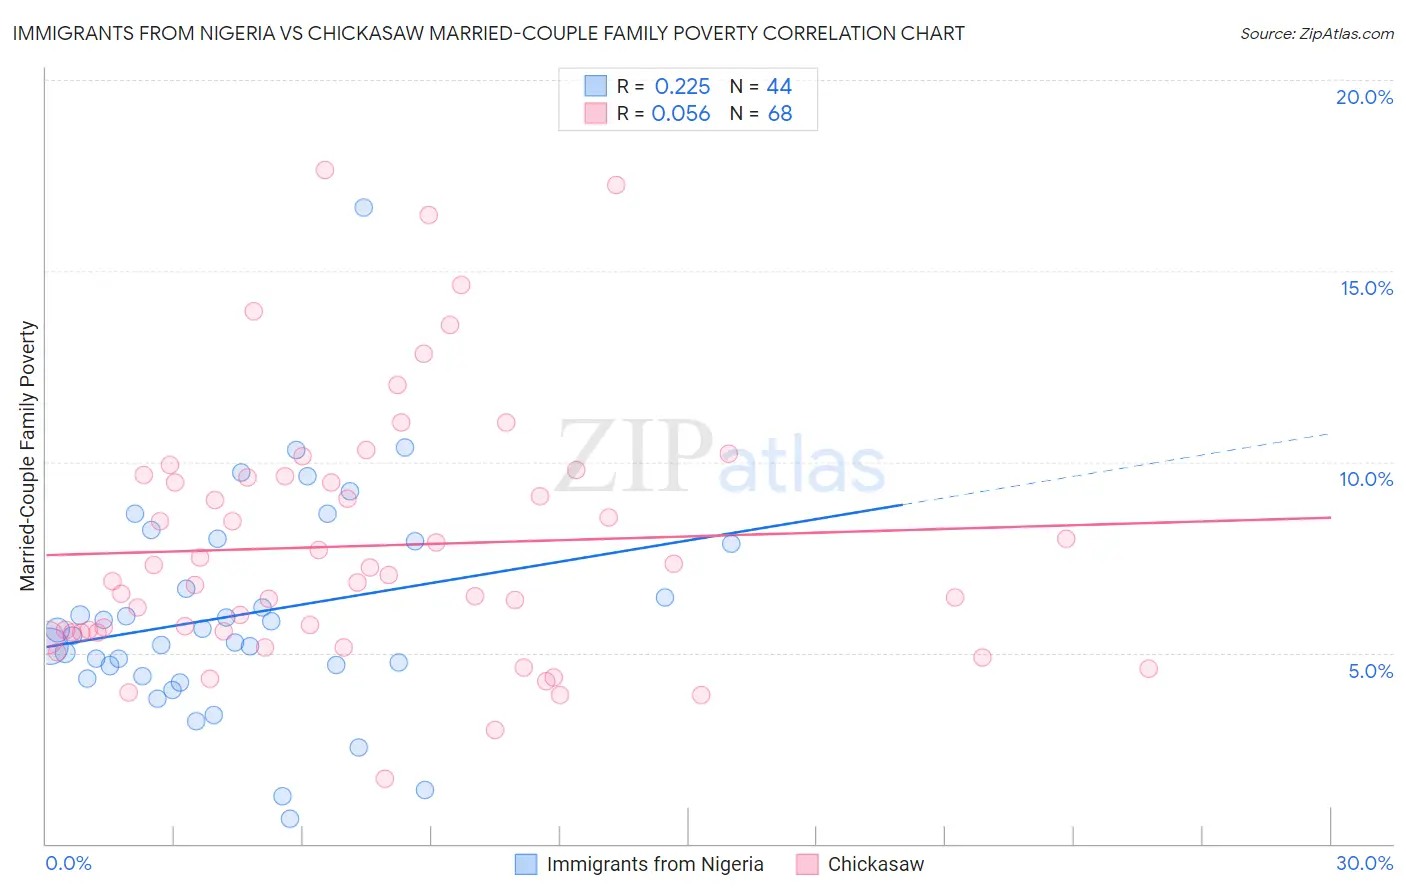
Immigrants from Nigeria vs Chickasaw Married-Couple Family Poverty Correlation Chart
The statistical analysis conducted on geographies consisting of 282,008,178 people shows a weak positive correlation between the proportion of Immigrants from Nigeria and poverty level among married-couple families in the United States with a correlation coefficient (R) of 0.225 and weighted average of 5.5%. Similarly, the statistical analysis conducted on geographies consisting of 147,342,221 people shows a slight positive correlation between the proportion of Chickasaw and poverty level among married-couple families in the United States with a correlation coefficient (R) of 0.056 and weighted average of 5.8%, a difference of 4.7%.
Married-Couple Family Poverty Correlation Summary
| Measurement | Immigrants from Nigeria | Chickasaw |
| Minimum | 0.65% | 1.7% |
| Maximum | 16.7% | 17.6% |
| Range | 16.0% | 16.0% |
| Mean | 6.0% | 7.8% |
| Median | 5.5% | 7.0% |
| Interquartile 25% (IQ1) | 4.5% | 5.5% |
| Interquartile 75% (IQ3) | 7.9% | 9.6% |
| Interquartile Range (IQR) | 3.4% | 4.1% |
| Standard Deviation (Sample) | 2.8% | 3.4% |
| Standard Deviation (Population) | 2.8% | 3.3% |
Similar Demographics by Married-Couple Family Poverty
Demographics Similar to Immigrants from Nigeria by Married-Couple Family Poverty
In terms of married-couple family poverty, the demographic groups most similar to Immigrants from Nigeria are Afghan (5.5%, a difference of 0.020%), Potawatomi (5.5%, a difference of 0.29%), Armenian (5.5%, a difference of 0.41%), Japanese (5.6%, a difference of 0.42%), and Iroquois (5.5%, a difference of 0.47%).
| Demographics | Rating | Rank | Married-Couple Family Poverty |
| Immigrants | Micronesia | 14.4 /100 | #210 | Poor 5.5% |
| Nigerians | 14.3 /100 | #211 | Poor 5.5% |
| Immigrants | Thailand | 14.0 /100 | #212 | Poor 5.5% |
| Immigrants | Liberia | 13.3 /100 | #213 | Poor 5.5% |
| Iroquois | 13.1 /100 | #214 | Poor 5.5% |
| Armenians | 12.8 /100 | #215 | Poor 5.5% |
| Potawatomi | 12.4 /100 | #216 | Poor 5.5% |
| Immigrants | Nigeria | 11.3 /100 | #217 | Poor 5.5% |
| Afghans | 11.2 /100 | #218 | Poor 5.5% |
| Japanese | 9.8 /100 | #219 | Tragic 5.6% |
| Colombians | 9.2 /100 | #220 | Tragic 5.6% |
| Panamanians | 9.2 /100 | #221 | Tragic 5.6% |
| Cajuns | 6.9 /100 | #222 | Tragic 5.6% |
| Immigrants | Fiji | 6.7 /100 | #223 | Tragic 5.6% |
| Sudanese | 6.4 /100 | #224 | Tragic 5.6% |
Demographics Similar to Chickasaw by Married-Couple Family Poverty
In terms of married-couple family poverty, the demographic groups most similar to Chickasaw are Somali (5.8%, a difference of 0.010%), Immigrants from Afghanistan (5.8%, a difference of 0.15%), Immigrants from Western Africa (5.8%, a difference of 0.17%), Immigrants from Panama (5.8%, a difference of 0.26%), and Fijian (5.8%, a difference of 0.28%).
| Demographics | Rating | Rank | Married-Couple Family Poverty |
| Immigrants | South America | 3.1 /100 | #237 | Tragic 5.7% |
| Cherokee | 2.7 /100 | #238 | Tragic 5.8% |
| Venezuelans | 2.7 /100 | #239 | Tragic 5.8% |
| Fijians | 2.5 /100 | #240 | Tragic 5.8% |
| Immigrants | Panama | 2.5 /100 | #241 | Tragic 5.8% |
| Immigrants | Western Africa | 2.4 /100 | #242 | Tragic 5.8% |
| Somalis | 2.3 /100 | #243 | Tragic 5.8% |
| Chickasaw | 2.3 /100 | #244 | Tragic 5.8% |
| Immigrants | Afghanistan | 2.1 /100 | #245 | Tragic 5.8% |
| Immigrants | Venezuela | 1.8 /100 | #246 | Tragic 5.8% |
| Iraqis | 1.4 /100 | #247 | Tragic 5.9% |
| Cree | 1.2 /100 | #248 | Tragic 5.9% |
| Tsimshian | 1.1 /100 | #249 | Tragic 5.9% |
| Immigrants | Eritrea | 1.1 /100 | #250 | Tragic 5.9% |
| Immigrants | Ghana | 1.0 /100 | #251 | Tragic 5.9% |