Immigrants from Nigeria vs Lithuanian Family Households
COMPARE
Immigrants from Nigeria
Lithuanian
Family Households
Family Households Comparison
Immigrants from Nigeria
Lithuanians
64.4%
FAMILY HOUSEHOLDS
60.1/ 100
METRIC RATING
164th/ 347
METRIC RANK
64.0%
FAMILY HOUSEHOLDS
23.8/ 100
METRIC RATING
192nd/ 347
METRIC RANK
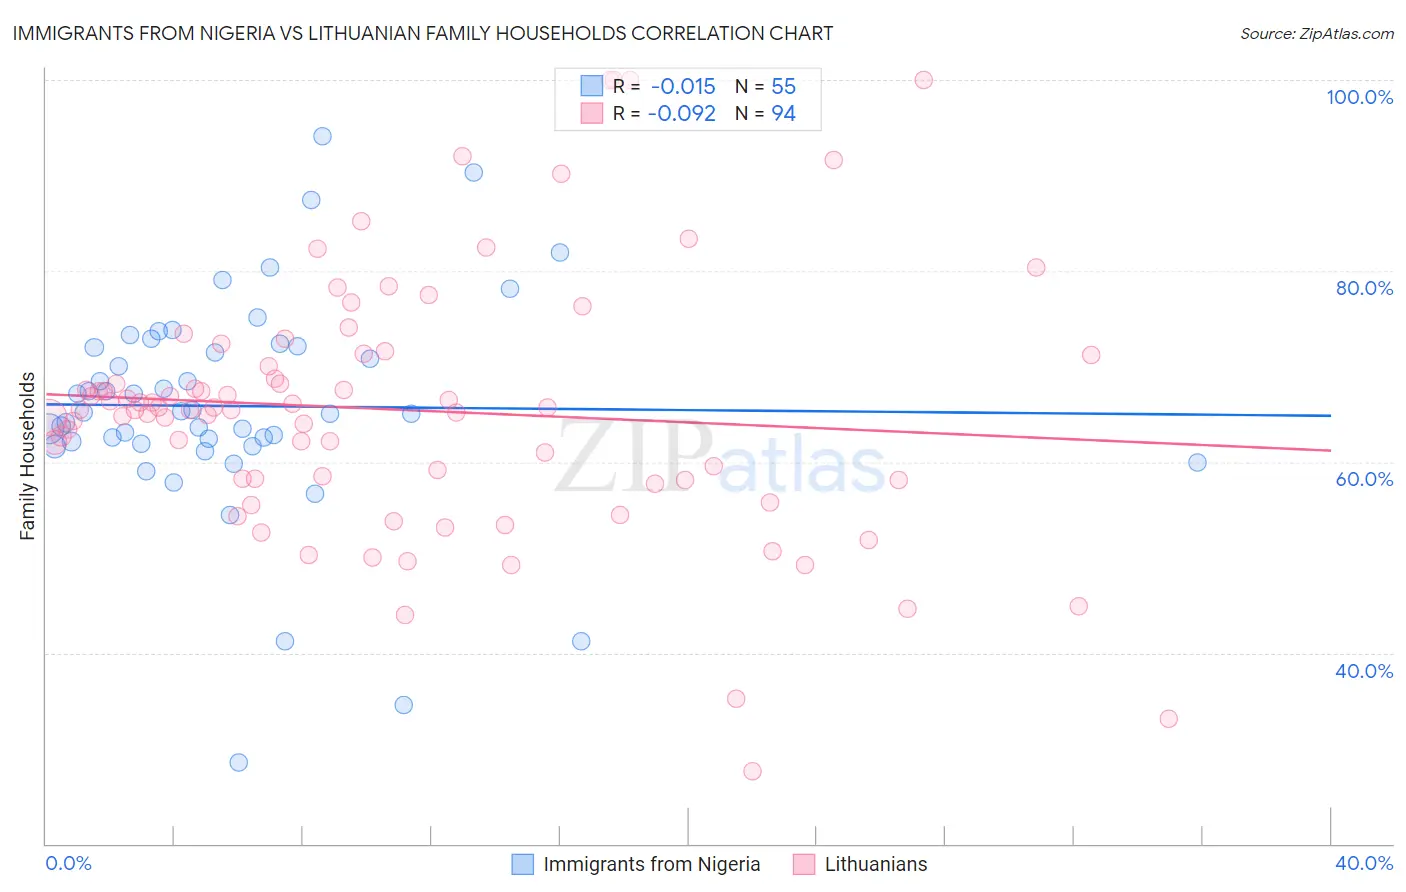
Immigrants from Nigeria vs Lithuanian Family Households Correlation Chart
The statistical analysis conducted on geographies consisting of 283,303,761 people shows no correlation between the proportion of Immigrants from Nigeria and percentage of family households in the United States with a correlation coefficient (R) of -0.015 and weighted average of 64.4%. Similarly, the statistical analysis conducted on geographies consisting of 421,743,433 people shows a slight negative correlation between the proportion of Lithuanians and percentage of family households in the United States with a correlation coefficient (R) of -0.092 and weighted average of 64.0%, a difference of 0.53%.
Family Households Correlation Summary
| Measurement | Immigrants from Nigeria | Lithuanian |
| Minimum | 28.6% | 27.6% |
| Maximum | 94.1% | 100.0% |
| Range | 65.6% | 72.4% |
| Mean | 65.9% | 65.5% |
| Median | 65.1% | 65.5% |
| Interquartile 25% (IQ1) | 61.8% | 58.1% |
| Interquartile 75% (IQ3) | 72.1% | 71.3% |
| Interquartile Range (IQR) | 10.2% | 13.1% |
| Standard Deviation (Sample) | 11.7% | 13.6% |
| Standard Deviation (Population) | 11.6% | 13.6% |
Similar Demographics by Family Households
Demographics Similar to Immigrants from Nigeria by Family Households
In terms of family households, the demographic groups most similar to Immigrants from Nigeria are Immigrants from Southern Europe (64.4%, a difference of 0.0%), Scotch-Irish (64.4%, a difference of 0.010%), British (64.4%, a difference of 0.020%), Chickasaw (64.4%, a difference of 0.020%), and Irish (64.4%, a difference of 0.030%).
| Demographics | Rating | Rank | Family Households |
| Canadians | 66.6 /100 | #157 | Good 64.4% |
| Lebanese | 66.4 /100 | #158 | Good 64.4% |
| Germans | 65.8 /100 | #159 | Good 64.4% |
| Immigrants | Moldova | 65.2 /100 | #160 | Good 64.4% |
| Immigrants | England | 62.6 /100 | #161 | Good 64.4% |
| British | 61.6 /100 | #162 | Good 64.4% |
| Chickasaw | 61.5 /100 | #163 | Good 64.4% |
| Immigrants | Nigeria | 60.1 /100 | #164 | Good 64.4% |
| Immigrants | Southern Europe | 60.0 /100 | #165 | Good 64.4% |
| Scotch-Irish | 59.2 /100 | #166 | Average 64.4% |
| Irish | 57.9 /100 | #167 | Average 64.4% |
| Hondurans | 57.5 /100 | #168 | Average 64.4% |
| Iraqis | 56.0 /100 | #169 | Average 64.4% |
| Armenians | 55.9 /100 | #170 | Average 64.4% |
| Ute | 54.6 /100 | #171 | Average 64.3% |
Demographics Similar to Lithuanians by Family Households
In terms of family households, the demographic groups most similar to Lithuanians are French (64.0%, a difference of 0.0%), Arab (64.1%, a difference of 0.010%), Zimbabwean (64.1%, a difference of 0.020%), Immigrants from Western Asia (64.1%, a difference of 0.030%), and Paiute (64.0%, a difference of 0.030%).
| Demographics | Rating | Rank | Family Households |
| Immigrants | Iran | 30.4 /100 | #185 | Fair 64.1% |
| Spanish Americans | 30.1 /100 | #186 | Fair 64.1% |
| Northern Europeans | 28.2 /100 | #187 | Fair 64.1% |
| Paraguayans | 26.7 /100 | #188 | Fair 64.1% |
| Immigrants | Western Asia | 25.3 /100 | #189 | Fair 64.1% |
| Zimbabweans | 24.7 /100 | #190 | Fair 64.1% |
| Arabs | 24.5 /100 | #191 | Fair 64.1% |
| Lithuanians | 23.8 /100 | #192 | Fair 64.0% |
| French | 23.7 /100 | #193 | Fair 64.0% |
| Paiute | 22.2 /100 | #194 | Fair 64.0% |
| Immigrants | North America | 20.0 /100 | #195 | Poor 64.0% |
| Immigrants | Canada | 19.2 /100 | #196 | Poor 64.0% |
| Seminole | 18.9 /100 | #197 | Poor 64.0% |
| Poles | 18.9 /100 | #198 | Poor 64.0% |
| Slavs | 18.6 /100 | #199 | Poor 64.0% |