Irish vs Carpatho Rusyn College, 1 year or more
COMPARE
Irish
Carpatho Rusyn
College, 1 year or more
College, 1 year or more Comparison
Irish
Carpatho Rusyns
59.6%
COLLEGE, 1 YEAR OR MORE
56.1/ 100
METRIC RATING
165th/ 347
METRIC RANK
62.2%
COLLEGE, 1 YEAR OR MORE
97.2/ 100
METRIC RATING
98th/ 347
METRIC RANK
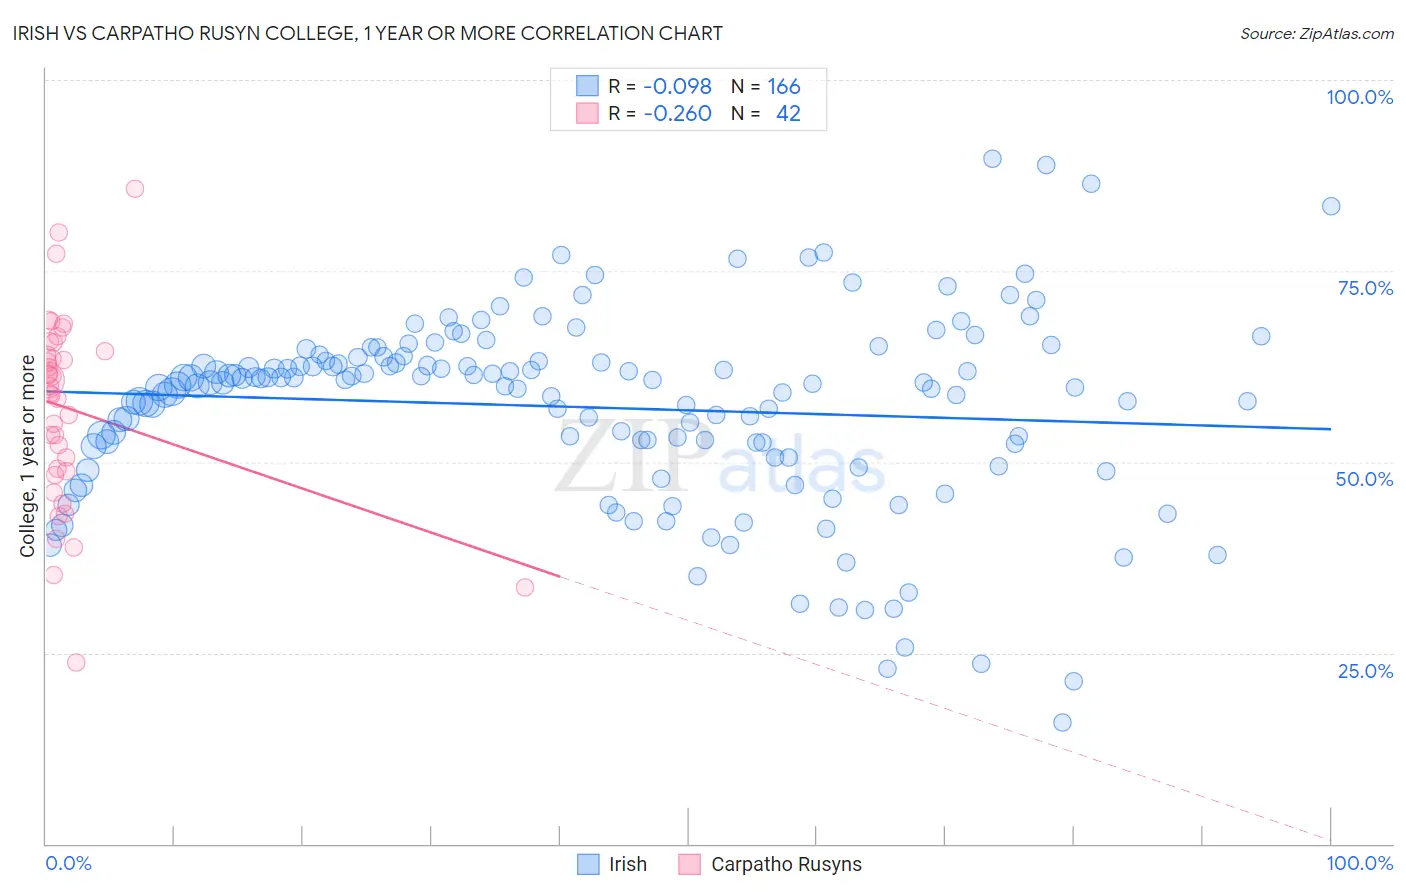
Irish vs Carpatho Rusyn College, 1 year or more Correlation Chart
The statistical analysis conducted on geographies consisting of 580,683,064 people shows a slight negative correlation between the proportion of Irish and percentage of population with at least college, 1 year or more education in the United States with a correlation coefficient (R) of -0.098 and weighted average of 59.6%. Similarly, the statistical analysis conducted on geographies consisting of 58,871,690 people shows a weak negative correlation between the proportion of Carpatho Rusyns and percentage of population with at least college, 1 year or more education in the United States with a correlation coefficient (R) of -0.260 and weighted average of 62.2%, a difference of 4.3%.
College, 1 year or more Correlation Summary
| Measurement | Irish | Carpatho Rusyn |
| Minimum | 16.0% | 23.7% |
| Maximum | 89.7% | 85.7% |
| Range | 73.7% | 62.1% |
| Mean | 57.1% | 56.9% |
| Median | 60.3% | 59.4% |
| Interquartile 25% (IQ1) | 52.0% | 48.8% |
| Interquartile 75% (IQ3) | 63.2% | 64.5% |
| Interquartile Range (IQR) | 11.2% | 15.6% |
| Standard Deviation (Sample) | 12.7% | 12.7% |
| Standard Deviation (Population) | 12.6% | 12.5% |
Similar Demographics by College, 1 year or more
Demographics Similar to Irish by College, 1 year or more
In terms of college, 1 year or more, the demographic groups most similar to Irish are Immigrants from Africa (59.6%, a difference of 0.0%), Belgian (59.7%, a difference of 0.11%), Immigrants from Somalia (59.7%, a difference of 0.12%), Korean (59.7%, a difference of 0.13%), and Immigrants from North Macedonia (59.5%, a difference of 0.16%).
| Demographics | Rating | Rank | College, 1 year or more |
| English | 67.2 /100 | #158 | Good 60.0% |
| Immigrants | Iraq | 67.0 /100 | #159 | Good 60.0% |
| South American Indians | 66.9 /100 | #160 | Good 60.0% |
| Somalis | 64.5 /100 | #161 | Good 59.9% |
| Koreans | 58.5 /100 | #162 | Average 59.7% |
| Immigrants | Somalia | 58.3 /100 | #163 | Average 59.7% |
| Belgians | 58.1 /100 | #164 | Average 59.7% |
| Irish | 56.1 /100 | #165 | Average 59.6% |
| Immigrants | Africa | 56.1 /100 | #166 | Average 59.6% |
| Immigrants | North Macedonia | 53.1 /100 | #167 | Average 59.5% |
| Hungarians | 52.9 /100 | #168 | Average 59.5% |
| Immigrants | Southern Europe | 52.7 /100 | #169 | Average 59.5% |
| Welsh | 52.4 /100 | #170 | Average 59.5% |
| Immigrants | Albania | 52.3 /100 | #171 | Average 59.5% |
| Immigrants | Sierra Leone | 52.2 /100 | #172 | Average 59.5% |
Demographics Similar to Carpatho Rusyns by College, 1 year or more
In terms of college, 1 year or more, the demographic groups most similar to Carpatho Rusyns are Jordanian (62.2%, a difference of 0.0%), Croatian (62.2%, a difference of 0.0%), Chinese (62.2%, a difference of 0.010%), British (62.3%, a difference of 0.12%), and Icelander (62.1%, a difference of 0.17%).
| Demographics | Rating | Rank | College, 1 year or more |
| Immigrants | Eastern Europe | 97.8 /100 | #91 | Exceptional 62.4% |
| Immigrants | Egypt | 97.8 /100 | #92 | Exceptional 62.4% |
| Romanians | 97.7 /100 | #93 | Exceptional 62.4% |
| Immigrants | Croatia | 97.6 /100 | #94 | Exceptional 62.3% |
| British | 97.4 /100 | #95 | Exceptional 62.3% |
| Chinese | 97.2 /100 | #96 | Exceptional 62.2% |
| Jordanians | 97.2 /100 | #97 | Exceptional 62.2% |
| Carpatho Rusyns | 97.2 /100 | #98 | Exceptional 62.2% |
| Croatians | 97.1 /100 | #99 | Exceptional 62.2% |
| Icelanders | 96.8 /100 | #100 | Exceptional 62.1% |
| Swedes | 96.8 /100 | #101 | Exceptional 62.1% |
| Luxembourgers | 96.7 /100 | #102 | Exceptional 62.1% |
| Afghans | 96.4 /100 | #103 | Exceptional 62.0% |
| Chileans | 96.4 /100 | #104 | Exceptional 62.0% |
| Immigrants | Nepal | 96.3 /100 | #105 | Exceptional 62.0% |