Irish vs Immigrants from Caribbean College, 1 year or more
COMPARE
Irish
Immigrants from Caribbean
College, 1 year or more
College, 1 year or more Comparison
Irish
Immigrants from Caribbean
59.6%
COLLEGE, 1 YEAR OR MORE
56.1/ 100
METRIC RATING
165th/ 347
METRIC RANK
51.4%
COLLEGE, 1 YEAR OR MORE
0.0/ 100
METRIC RATING
313th/ 347
METRIC RANK
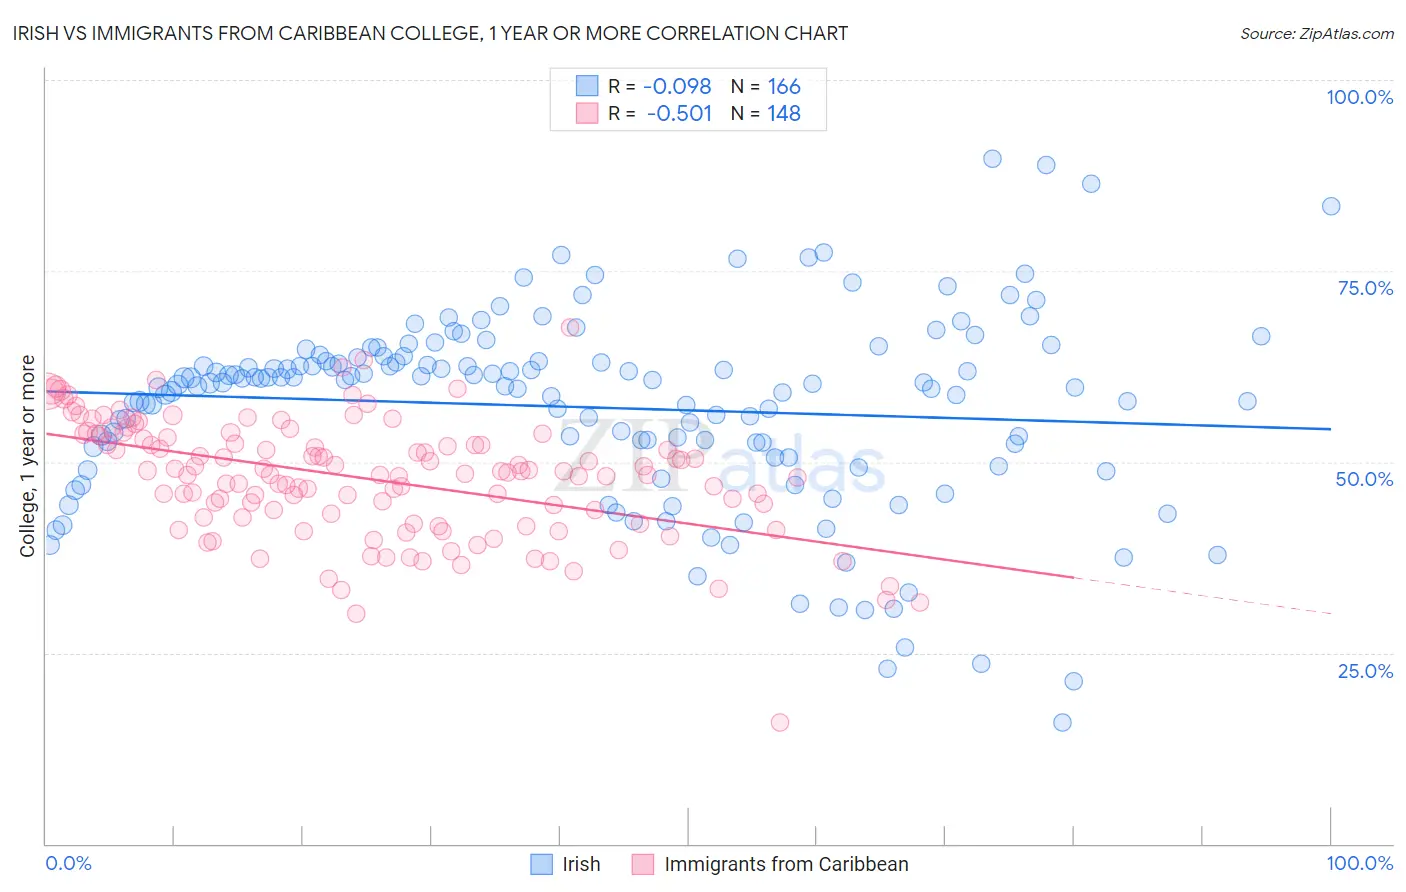
Irish vs Immigrants from Caribbean College, 1 year or more Correlation Chart
The statistical analysis conducted on geographies consisting of 580,683,064 people shows a slight negative correlation between the proportion of Irish and percentage of population with at least college, 1 year or more education in the United States with a correlation coefficient (R) of -0.098 and weighted average of 59.6%. Similarly, the statistical analysis conducted on geographies consisting of 450,060,902 people shows a substantial negative correlation between the proportion of Immigrants from Caribbean and percentage of population with at least college, 1 year or more education in the United States with a correlation coefficient (R) of -0.501 and weighted average of 51.4%, a difference of 15.9%.
College, 1 year or more Correlation Summary
| Measurement | Irish | Immigrants from Caribbean |
| Minimum | 16.0% | 15.9% |
| Maximum | 89.7% | 67.7% |
| Range | 73.7% | 51.8% |
| Mean | 57.1% | 47.8% |
| Median | 60.3% | 48.6% |
| Interquartile 25% (IQ1) | 52.0% | 42.7% |
| Interquartile 75% (IQ3) | 63.2% | 53.3% |
| Interquartile Range (IQR) | 11.2% | 10.6% |
| Standard Deviation (Sample) | 12.7% | 7.8% |
| Standard Deviation (Population) | 12.6% | 7.7% |
Similar Demographics by College, 1 year or more
Demographics Similar to Irish by College, 1 year or more
In terms of college, 1 year or more, the demographic groups most similar to Irish are Immigrants from Africa (59.6%, a difference of 0.0%), Belgian (59.7%, a difference of 0.11%), Immigrants from Somalia (59.7%, a difference of 0.12%), Korean (59.7%, a difference of 0.13%), and Immigrants from North Macedonia (59.5%, a difference of 0.16%).
| Demographics | Rating | Rank | College, 1 year or more |
| English | 67.2 /100 | #158 | Good 60.0% |
| Immigrants | Iraq | 67.0 /100 | #159 | Good 60.0% |
| South American Indians | 66.9 /100 | #160 | Good 60.0% |
| Somalis | 64.5 /100 | #161 | Good 59.9% |
| Koreans | 58.5 /100 | #162 | Average 59.7% |
| Immigrants | Somalia | 58.3 /100 | #163 | Average 59.7% |
| Belgians | 58.1 /100 | #164 | Average 59.7% |
| Irish | 56.1 /100 | #165 | Average 59.6% |
| Immigrants | Africa | 56.1 /100 | #166 | Average 59.6% |
| Immigrants | North Macedonia | 53.1 /100 | #167 | Average 59.5% |
| Hungarians | 52.9 /100 | #168 | Average 59.5% |
| Immigrants | Southern Europe | 52.7 /100 | #169 | Average 59.5% |
| Welsh | 52.4 /100 | #170 | Average 59.5% |
| Immigrants | Albania | 52.3 /100 | #171 | Average 59.5% |
| Immigrants | Sierra Leone | 52.2 /100 | #172 | Average 59.5% |
Demographics Similar to Immigrants from Caribbean by College, 1 year or more
In terms of college, 1 year or more, the demographic groups most similar to Immigrants from Caribbean are Pueblo (51.5%, a difference of 0.13%), Immigrants from Haiti (51.5%, a difference of 0.17%), Fijian (51.3%, a difference of 0.22%), Honduran (51.6%, a difference of 0.33%), and Guatemalan (51.2%, a difference of 0.45%).
| Demographics | Rating | Rank | College, 1 year or more |
| Mexican American Indians | 0.0 /100 | #306 | Tragic 51.9% |
| Immigrants | Portugal | 0.0 /100 | #307 | Tragic 51.9% |
| Salvadorans | 0.0 /100 | #308 | Tragic 51.8% |
| Apache | 0.0 /100 | #309 | Tragic 51.8% |
| Hondurans | 0.0 /100 | #310 | Tragic 51.6% |
| Immigrants | Haiti | 0.0 /100 | #311 | Tragic 51.5% |
| Pueblo | 0.0 /100 | #312 | Tragic 51.5% |
| Immigrants | Caribbean | 0.0 /100 | #313 | Tragic 51.4% |
| Fijians | 0.0 /100 | #314 | Tragic 51.3% |
| Guatemalans | 0.0 /100 | #315 | Tragic 51.2% |
| Cajuns | 0.0 /100 | #316 | Tragic 51.2% |
| Hispanics or Latinos | 0.0 /100 | #317 | Tragic 51.1% |
| Immigrants | Honduras | 0.0 /100 | #318 | Tragic 51.0% |
| Immigrants | El Salvador | 0.0 /100 | #319 | Tragic 51.0% |
| Kiowa | 0.0 /100 | #320 | Tragic 51.0% |