Irish vs Finnish College, 1 year or more
COMPARE
Irish
Finnish
College, 1 year or more
College, 1 year or more Comparison
Irish
Finns
59.6%
COLLEGE, 1 YEAR OR MORE
56.1/ 100
METRIC RATING
165th/ 347
METRIC RANK
60.2%
COLLEGE, 1 YEAR OR MORE
72.9/ 100
METRIC RATING
156th/ 347
METRIC RANK
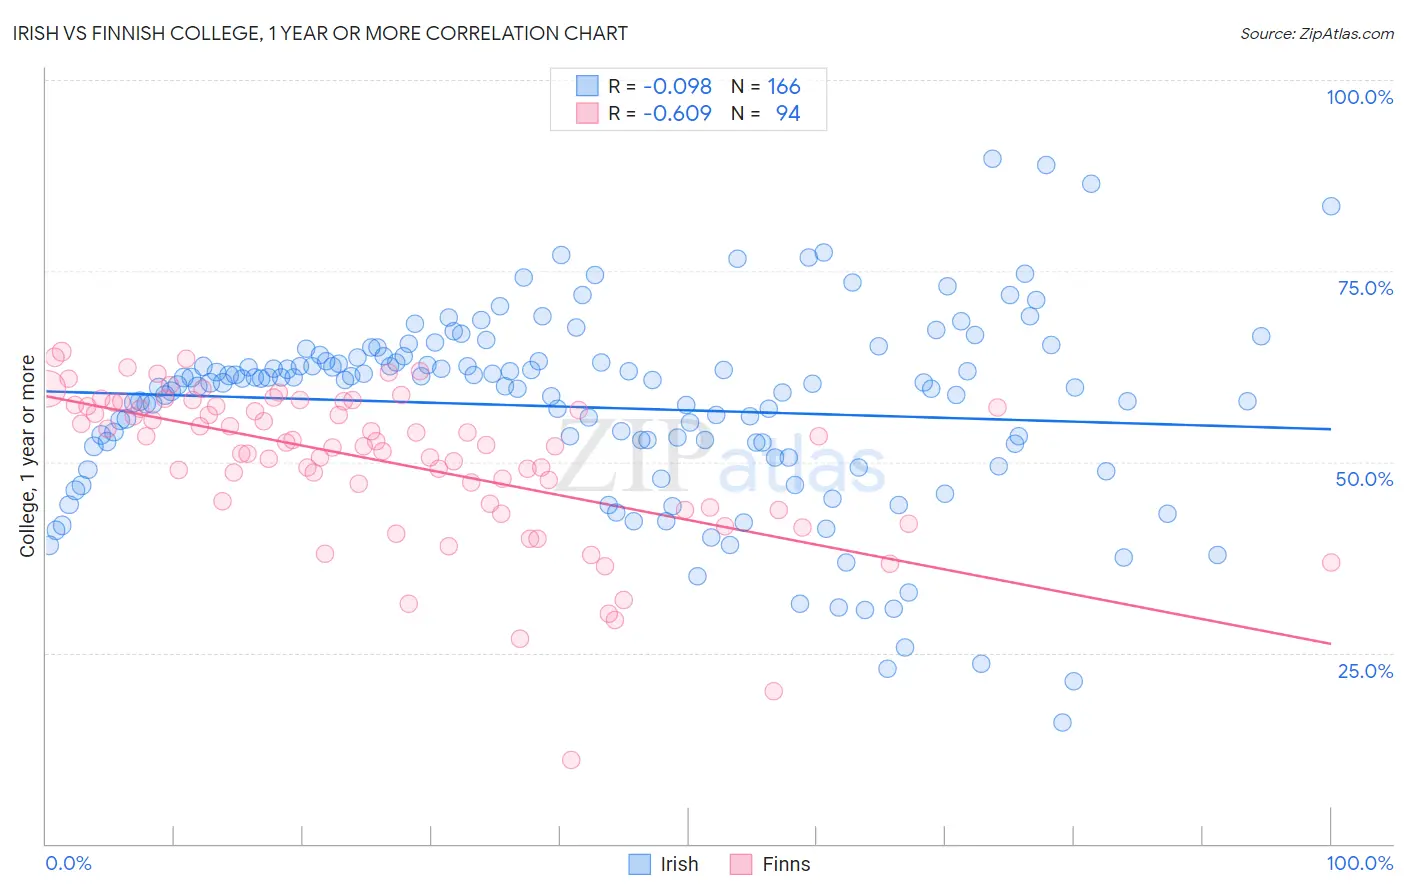
Irish vs Finnish College, 1 year or more Correlation Chart
The statistical analysis conducted on geographies consisting of 580,683,064 people shows a slight negative correlation between the proportion of Irish and percentage of population with at least college, 1 year or more education in the United States with a correlation coefficient (R) of -0.098 and weighted average of 59.6%. Similarly, the statistical analysis conducted on geographies consisting of 404,673,514 people shows a significant negative correlation between the proportion of Finns and percentage of population with at least college, 1 year or more education in the United States with a correlation coefficient (R) of -0.609 and weighted average of 60.2%, a difference of 0.99%.
College, 1 year or more Correlation Summary
| Measurement | Irish | Finnish |
| Minimum | 16.0% | 11.0% |
| Maximum | 89.7% | 64.4% |
| Range | 73.7% | 53.4% |
| Mean | 57.1% | 50.1% |
| Median | 60.3% | 52.3% |
| Interquartile 25% (IQ1) | 52.0% | 44.5% |
| Interquartile 75% (IQ3) | 63.2% | 57.3% |
| Interquartile Range (IQR) | 11.2% | 12.8% |
| Standard Deviation (Sample) | 12.7% | 10.0% |
| Standard Deviation (Population) | 12.6% | 9.9% |
Demographics Similar to Irish and Finns by College, 1 year or more
In terms of college, 1 year or more, the demographic groups most similar to Irish are Immigrants from Africa (59.6%, a difference of 0.0%), Belgian (59.7%, a difference of 0.11%), Immigrants from Somalia (59.7%, a difference of 0.12%), Korean (59.7%, a difference of 0.13%), and Immigrants from North Macedonia (59.5%, a difference of 0.16%). Similarly, the demographic groups most similar to Finns are Sudanese (60.2%, a difference of 0.0%), Moroccan (60.2%, a difference of 0.0%), Sierra Leonean (60.2%, a difference of 0.080%), Immigrants from Germany (60.3%, a difference of 0.22%), and Immigrants from Armenia (60.0%, a difference of 0.26%).
| Demographics | Rating | Rank | College, 1 year or more |
| Immigrants | Sudan | 77.8 /100 | #150 | Good 60.4% |
| Albanians | 77.8 /100 | #151 | Good 60.4% |
| Immigrants | Germany | 76.1 /100 | #152 | Good 60.3% |
| Sierra Leoneans | 74.1 /100 | #153 | Good 60.2% |
| Sudanese | 73.0 /100 | #154 | Good 60.2% |
| Moroccans | 72.9 /100 | #155 | Good 60.2% |
| Finns | 72.9 /100 | #156 | Good 60.2% |
| Immigrants | Armenia | 68.8 /100 | #157 | Good 60.0% |
| English | 67.2 /100 | #158 | Good 60.0% |
| Immigrants | Iraq | 67.0 /100 | #159 | Good 60.0% |
| South American Indians | 66.9 /100 | #160 | Good 60.0% |
| Somalis | 64.5 /100 | #161 | Good 59.9% |
| Koreans | 58.5 /100 | #162 | Average 59.7% |
| Immigrants | Somalia | 58.3 /100 | #163 | Average 59.7% |
| Belgians | 58.1 /100 | #164 | Average 59.7% |
| Irish | 56.1 /100 | #165 | Average 59.6% |
| Immigrants | Africa | 56.1 /100 | #166 | Average 59.6% |
| Immigrants | North Macedonia | 53.1 /100 | #167 | Average 59.5% |
| Hungarians | 52.9 /100 | #168 | Average 59.5% |
| Immigrants | Southern Europe | 52.7 /100 | #169 | Average 59.5% |
| Welsh | 52.4 /100 | #170 | Average 59.5% |