Comanche vs Puerto Rican College, 1 year or more
COMPARE
Comanche
Puerto Rican
College, 1 year or more
College, 1 year or more Comparison
Comanche
Puerto Ricans
54.4%
COLLEGE, 1 YEAR OR MORE
0.2/ 100
METRIC RATING
272nd/ 347
METRIC RANK
52.2%
COLLEGE, 1 YEAR OR MORE
0.0/ 100
METRIC RATING
302nd/ 347
METRIC RANK
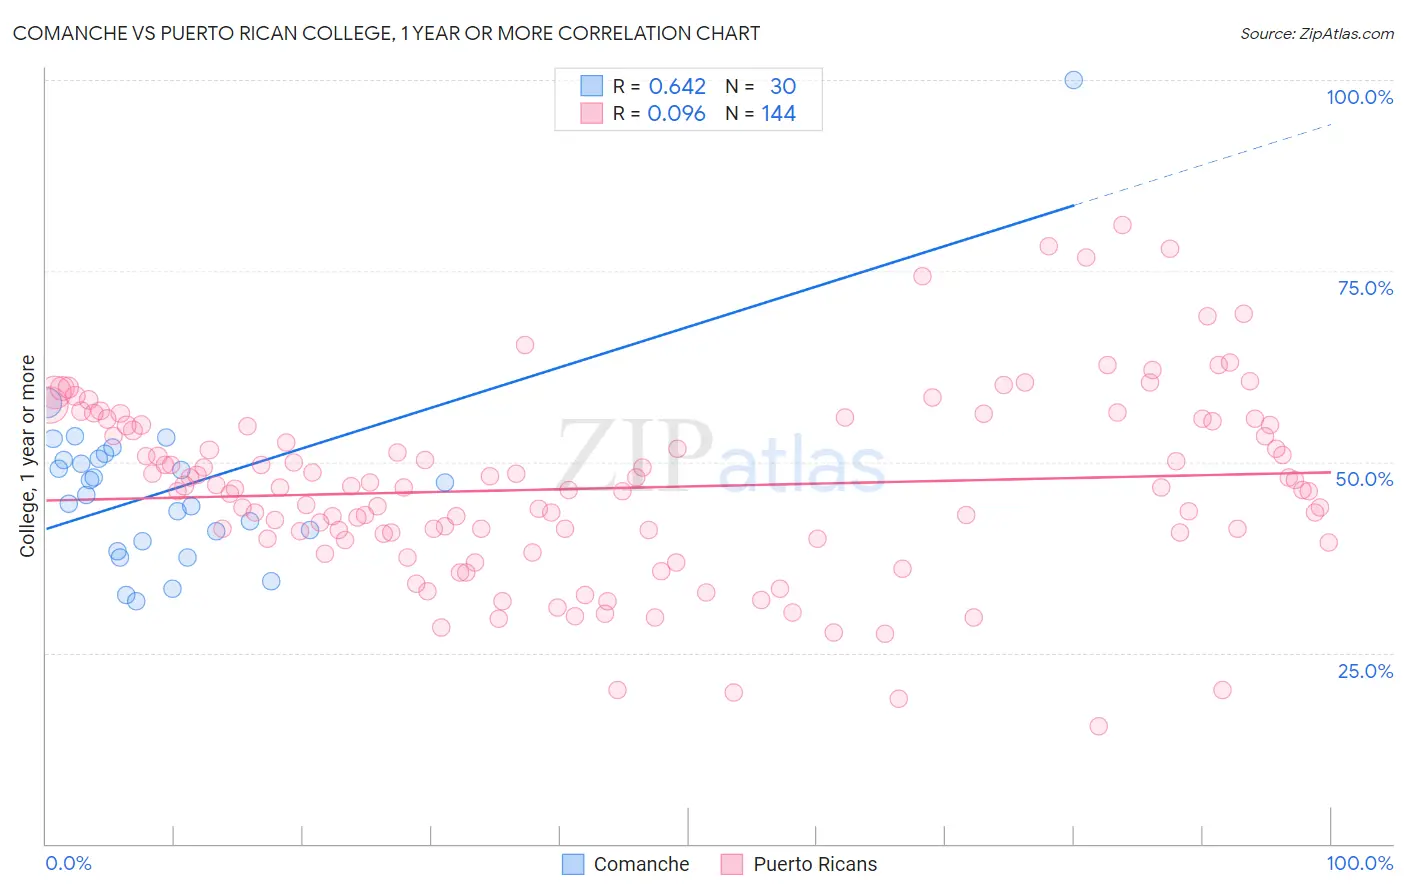
Comanche vs Puerto Rican College, 1 year or more Correlation Chart
The statistical analysis conducted on geographies consisting of 109,786,512 people shows a significant positive correlation between the proportion of Comanche and percentage of population with at least college, 1 year or more education in the United States with a correlation coefficient (R) of 0.642 and weighted average of 54.4%. Similarly, the statistical analysis conducted on geographies consisting of 528,315,563 people shows a slight positive correlation between the proportion of Puerto Ricans and percentage of population with at least college, 1 year or more education in the United States with a correlation coefficient (R) of 0.096 and weighted average of 52.2%, a difference of 4.2%.
College, 1 year or more Correlation Summary
| Measurement | Comanche | Puerto Rican |
| Minimum | 31.7% | 15.4% |
| Maximum | 100.0% | 81.0% |
| Range | 68.3% | 65.6% |
| Mean | 46.6% | 46.6% |
| Median | 46.5% | 46.6% |
| Interquartile 25% (IQ1) | 39.6% | 40.3% |
| Interquartile 75% (IQ3) | 50.4% | 54.8% |
| Interquartile Range (IQR) | 10.8% | 14.5% |
| Standard Deviation (Sample) | 12.2% | 12.0% |
| Standard Deviation (Population) | 12.0% | 12.0% |
Similar Demographics by College, 1 year or more
Demographics Similar to Comanche by College, 1 year or more
In terms of college, 1 year or more, the demographic groups most similar to Comanche are Immigrants from Grenada (54.4%, a difference of 0.040%), Bahamian (54.5%, a difference of 0.050%), Crow (54.5%, a difference of 0.070%), Belizean (54.4%, a difference of 0.080%), and Bangladeshi (54.5%, a difference of 0.10%).
| Demographics | Rating | Rank | College, 1 year or more |
| Immigrants | Laos | 0.2 /100 | #265 | Tragic 54.7% |
| Potawatomi | 0.2 /100 | #266 | Tragic 54.6% |
| Blackfeet | 0.2 /100 | #267 | Tragic 54.6% |
| British West Indians | 0.2 /100 | #268 | Tragic 54.5% |
| Bangladeshis | 0.2 /100 | #269 | Tragic 54.5% |
| Crow | 0.2 /100 | #270 | Tragic 54.5% |
| Bahamians | 0.2 /100 | #271 | Tragic 54.5% |
| Comanche | 0.2 /100 | #272 | Tragic 54.4% |
| Immigrants | Grenada | 0.2 /100 | #273 | Tragic 54.4% |
| Belizeans | 0.2 /100 | #274 | Tragic 54.4% |
| Americans | 0.2 /100 | #275 | Tragic 54.4% |
| Shoshone | 0.2 /100 | #276 | Tragic 54.3% |
| Ecuadorians | 0.2 /100 | #277 | Tragic 54.3% |
| Immigrants | Jamaica | 0.1 /100 | #278 | Tragic 54.2% |
| Arapaho | 0.1 /100 | #279 | Tragic 54.1% |
Demographics Similar to Puerto Ricans by College, 1 year or more
In terms of college, 1 year or more, the demographic groups most similar to Puerto Ricans are Creek (52.2%, a difference of 0.080%), Haitian (52.3%, a difference of 0.13%), Choctaw (52.3%, a difference of 0.19%), Central American (52.1%, a difference of 0.21%), and Immigrants from Nicaragua (52.4%, a difference of 0.23%).
| Demographics | Rating | Rank | College, 1 year or more |
| Yaqui | 0.0 /100 | #295 | Tragic 53.2% |
| Sioux | 0.0 /100 | #296 | Tragic 53.0% |
| Paiute | 0.0 /100 | #297 | Tragic 52.9% |
| Immigrants | Dominica | 0.0 /100 | #298 | Tragic 52.5% |
| Immigrants | Nicaragua | 0.0 /100 | #299 | Tragic 52.4% |
| Choctaw | 0.0 /100 | #300 | Tragic 52.3% |
| Haitians | 0.0 /100 | #301 | Tragic 52.3% |
| Puerto Ricans | 0.0 /100 | #302 | Tragic 52.2% |
| Creek | 0.0 /100 | #303 | Tragic 52.2% |
| Central Americans | 0.0 /100 | #304 | Tragic 52.1% |
| Seminole | 0.0 /100 | #305 | Tragic 52.1% |
| Mexican American Indians | 0.0 /100 | #306 | Tragic 51.9% |
| Immigrants | Portugal | 0.0 /100 | #307 | Tragic 51.9% |
| Salvadorans | 0.0 /100 | #308 | Tragic 51.8% |
| Apache | 0.0 /100 | #309 | Tragic 51.8% |