Comanche vs American College, 1 year or more
COMPARE
Comanche
American
College, 1 year or more
College, 1 year or more Comparison
Comanche
Americans
54.4%
COLLEGE, 1 YEAR OR MORE
0.2/ 100
METRIC RATING
272nd/ 347
METRIC RANK
54.4%
COLLEGE, 1 YEAR OR MORE
0.2/ 100
METRIC RATING
275th/ 347
METRIC RANK
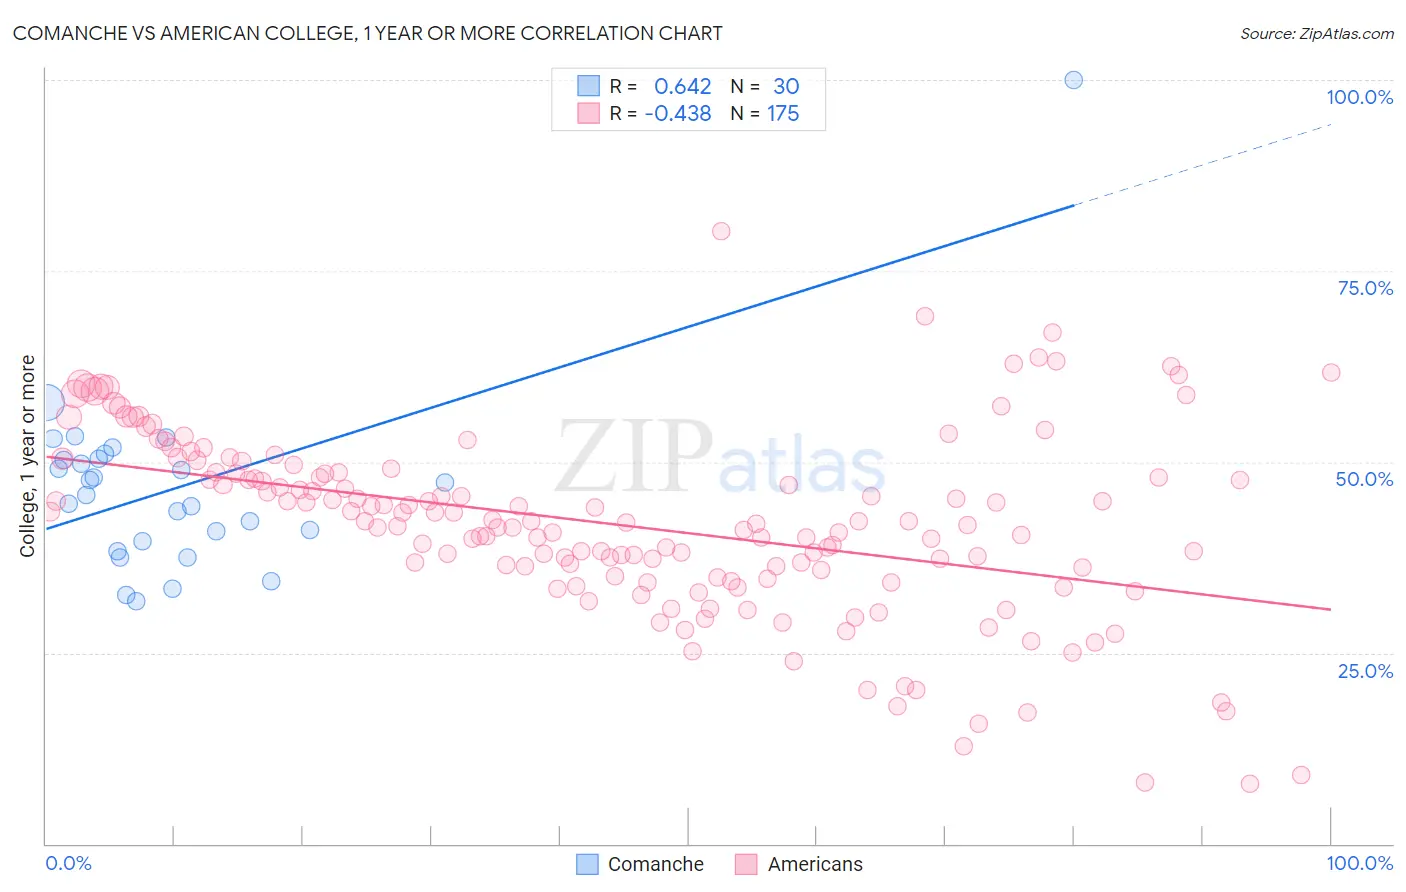
Comanche vs American College, 1 year or more Correlation Chart
The statistical analysis conducted on geographies consisting of 109,786,512 people shows a significant positive correlation between the proportion of Comanche and percentage of population with at least college, 1 year or more education in the United States with a correlation coefficient (R) of 0.642 and weighted average of 54.4%. Similarly, the statistical analysis conducted on geographies consisting of 581,967,268 people shows a moderate negative correlation between the proportion of Americans and percentage of population with at least college, 1 year or more education in the United States with a correlation coefficient (R) of -0.438 and weighted average of 54.4%, a difference of 0.10%.
College, 1 year or more Correlation Summary
| Measurement | Comanche | American |
| Minimum | 31.7% | 7.8% |
| Maximum | 100.0% | 80.1% |
| Range | 68.3% | 72.3% |
| Mean | 46.6% | 41.8% |
| Median | 46.5% | 42.0% |
| Interquartile 25% (IQ1) | 39.6% | 35.0% |
| Interquartile 75% (IQ3) | 50.4% | 48.5% |
| Interquartile Range (IQR) | 10.8% | 13.6% |
| Standard Deviation (Sample) | 12.2% | 12.1% |
| Standard Deviation (Population) | 12.0% | 12.0% |
Demographics Similar to Comanche and Americans by College, 1 year or more
In terms of college, 1 year or more, the demographic groups most similar to Comanche are Immigrants from Grenada (54.4%, a difference of 0.040%), Bahamian (54.5%, a difference of 0.050%), Crow (54.5%, a difference of 0.070%), Belizean (54.4%, a difference of 0.080%), and Bangladeshi (54.5%, a difference of 0.10%). Similarly, the demographic groups most similar to Americans are Belizean (54.4%, a difference of 0.020%), Immigrants from Grenada (54.4%, a difference of 0.060%), Shoshone (54.3%, a difference of 0.080%), Ecuadorian (54.3%, a difference of 0.12%), and Bahamian (54.5%, a difference of 0.15%).
| Demographics | Rating | Rank | College, 1 year or more |
| U.S. Virgin Islanders | 0.3 /100 | #263 | Tragic 54.8% |
| Immigrants | Micronesia | 0.3 /100 | #264 | Tragic 54.8% |
| Immigrants | Laos | 0.2 /100 | #265 | Tragic 54.7% |
| Potawatomi | 0.2 /100 | #266 | Tragic 54.6% |
| Blackfeet | 0.2 /100 | #267 | Tragic 54.6% |
| British West Indians | 0.2 /100 | #268 | Tragic 54.5% |
| Bangladeshis | 0.2 /100 | #269 | Tragic 54.5% |
| Crow | 0.2 /100 | #270 | Tragic 54.5% |
| Bahamians | 0.2 /100 | #271 | Tragic 54.5% |
| Comanche | 0.2 /100 | #272 | Tragic 54.4% |
| Immigrants | Grenada | 0.2 /100 | #273 | Tragic 54.4% |
| Belizeans | 0.2 /100 | #274 | Tragic 54.4% |
| Americans | 0.2 /100 | #275 | Tragic 54.4% |
| Shoshone | 0.2 /100 | #276 | Tragic 54.3% |
| Ecuadorians | 0.2 /100 | #277 | Tragic 54.3% |
| Immigrants | Jamaica | 0.1 /100 | #278 | Tragic 54.2% |
| Arapaho | 0.1 /100 | #279 | Tragic 54.1% |
| Cheyenne | 0.1 /100 | #280 | Tragic 54.1% |
| Colville | 0.1 /100 | #281 | Tragic 54.1% |
| Guyanese | 0.1 /100 | #282 | Tragic 54.1% |
| Nicaraguans | 0.1 /100 | #283 | Tragic 53.9% |