Comanche vs British College, 1 year or more
COMPARE
Comanche
British
College, 1 year or more
College, 1 year or more Comparison
Comanche
British
54.4%
COLLEGE, 1 YEAR OR MORE
0.2/ 100
METRIC RATING
272nd/ 347
METRIC RANK
62.3%
COLLEGE, 1 YEAR OR MORE
97.4/ 100
METRIC RATING
95th/ 347
METRIC RANK
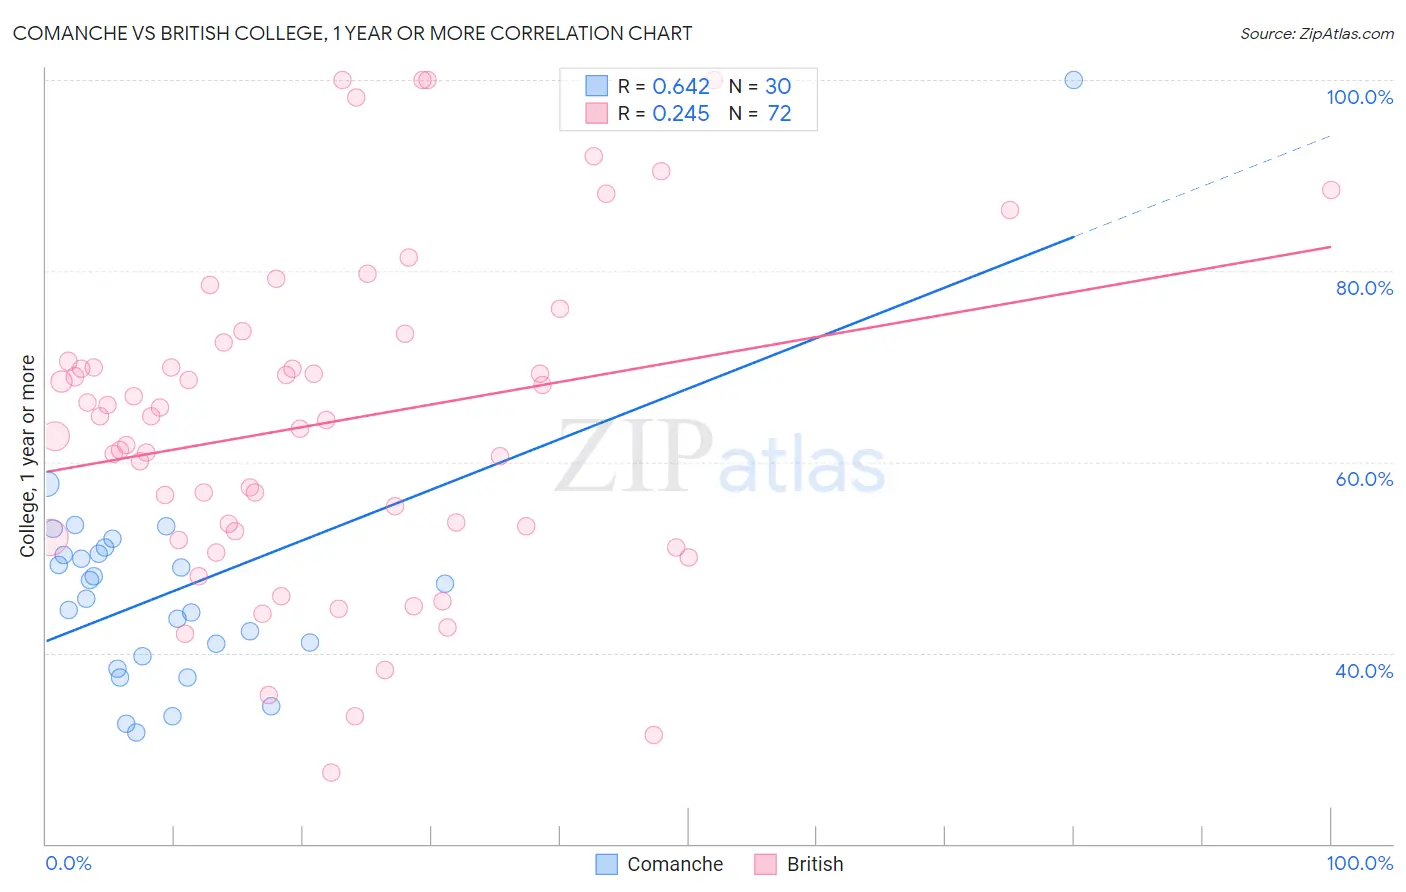
Comanche vs British College, 1 year or more Correlation Chart
The statistical analysis conducted on geographies consisting of 109,786,512 people shows a significant positive correlation between the proportion of Comanche and percentage of population with at least college, 1 year or more education in the United States with a correlation coefficient (R) of 0.642 and weighted average of 54.4%. Similarly, the statistical analysis conducted on geographies consisting of 531,458,915 people shows a weak positive correlation between the proportion of British and percentage of population with at least college, 1 year or more education in the United States with a correlation coefficient (R) of 0.245 and weighted average of 62.3%, a difference of 14.4%.
College, 1 year or more Correlation Summary
| Measurement | Comanche | British |
| Minimum | 31.7% | 27.5% |
| Maximum | 100.0% | 100.0% |
| Range | 68.3% | 72.5% |
| Mean | 46.6% | 64.1% |
| Median | 46.5% | 64.6% |
| Interquartile 25% (IQ1) | 39.6% | 52.5% |
| Interquartile 75% (IQ3) | 50.4% | 71.5% |
| Interquartile Range (IQR) | 10.8% | 19.0% |
| Standard Deviation (Sample) | 12.2% | 17.1% |
| Standard Deviation (Population) | 12.0% | 17.0% |
Similar Demographics by College, 1 year or more
Demographics Similar to Comanche by College, 1 year or more
In terms of college, 1 year or more, the demographic groups most similar to Comanche are Immigrants from Grenada (54.4%, a difference of 0.040%), Bahamian (54.5%, a difference of 0.050%), Crow (54.5%, a difference of 0.070%), Belizean (54.4%, a difference of 0.080%), and Bangladeshi (54.5%, a difference of 0.10%).
| Demographics | Rating | Rank | College, 1 year or more |
| Immigrants | Laos | 0.2 /100 | #265 | Tragic 54.7% |
| Potawatomi | 0.2 /100 | #266 | Tragic 54.6% |
| Blackfeet | 0.2 /100 | #267 | Tragic 54.6% |
| British West Indians | 0.2 /100 | #268 | Tragic 54.5% |
| Bangladeshis | 0.2 /100 | #269 | Tragic 54.5% |
| Crow | 0.2 /100 | #270 | Tragic 54.5% |
| Bahamians | 0.2 /100 | #271 | Tragic 54.5% |
| Comanche | 0.2 /100 | #272 | Tragic 54.4% |
| Immigrants | Grenada | 0.2 /100 | #273 | Tragic 54.4% |
| Belizeans | 0.2 /100 | #274 | Tragic 54.4% |
| Americans | 0.2 /100 | #275 | Tragic 54.4% |
| Shoshone | 0.2 /100 | #276 | Tragic 54.3% |
| Ecuadorians | 0.2 /100 | #277 | Tragic 54.3% |
| Immigrants | Jamaica | 0.1 /100 | #278 | Tragic 54.2% |
| Arapaho | 0.1 /100 | #279 | Tragic 54.1% |
Demographics Similar to British by College, 1 year or more
In terms of college, 1 year or more, the demographic groups most similar to British are Immigrants from Croatia (62.3%, a difference of 0.10%), Chinese (62.2%, a difference of 0.12%), Jordanian (62.2%, a difference of 0.12%), Carpatho Rusyn (62.2%, a difference of 0.12%), and Croatian (62.2%, a difference of 0.13%).
| Demographics | Rating | Rank | College, 1 year or more |
| Greeks | 98.3 /100 | #88 | Exceptional 62.6% |
| Immigrants | Ethiopia | 98.2 /100 | #89 | Exceptional 62.6% |
| Immigrants | Western Asia | 97.9 /100 | #90 | Exceptional 62.5% |
| Immigrants | Eastern Europe | 97.8 /100 | #91 | Exceptional 62.4% |
| Immigrants | Egypt | 97.8 /100 | #92 | Exceptional 62.4% |
| Romanians | 97.7 /100 | #93 | Exceptional 62.4% |
| Immigrants | Croatia | 97.6 /100 | #94 | Exceptional 62.3% |
| British | 97.4 /100 | #95 | Exceptional 62.3% |
| Chinese | 97.2 /100 | #96 | Exceptional 62.2% |
| Jordanians | 97.2 /100 | #97 | Exceptional 62.2% |
| Carpatho Rusyns | 97.2 /100 | #98 | Exceptional 62.2% |
| Croatians | 97.1 /100 | #99 | Exceptional 62.2% |
| Icelanders | 96.8 /100 | #100 | Exceptional 62.1% |
| Swedes | 96.8 /100 | #101 | Exceptional 62.1% |
| Luxembourgers | 96.7 /100 | #102 | Exceptional 62.1% |