Comanche vs Immigrants from Europe College, 1 year or more

COMPARE

Comanche
Race
Ancestry
AfghanAfricanAlaska NativeAlaskan AthabascanAlbanianAleutAlsatianAmericanApacheArabArapahoArgentineanArmenianAssyrian/Chaldean/SyriacAustralianAustrianBahamianBangladeshiBarbadianBasqueBelgianBelizeanBermudanBhutaneseBlackfeetBolivianBrazilianBritishBritish West IndianBulgarianBurmeseCajunCambodianCanadianCape VerdeanCarpatho RusynCelticCentral AmericanCentral American IndianCherokeeCheyenneChickasawChileanChineseChippewaChoctawColombianColvilleComancheCosta RicanCreeCreekCroatianCrowCubanCypriotCzechCzechoslovakianDanishDelawareDominicanDutchDutch West IndianEastern EuropeanEcuadorianEgyptianEnglishEstonianEthiopianEuropeanFijianFilipinoFinnishFrenchFrench American IndianFrench CanadianGermanGerman RussianGhanaianGreekGuamanian/ChamorroGuatemalanGuyaneseHaitianHmongHonduranHopiHoumaHungarianIcelanderIndian (Asian)IndonesianInupiatIranianIraqiIrishIroquoisIsraeliItalianJamaicanJapaneseJordanianKenyanKiowaKoreanLaotianLatvianLebaneseLiberianLithuanianLumbeeLuxembourgerMacedonianMalaysianMalteseMarshalleseMenomineeMexicanMexican American IndianMongolianMoroccanNative HawaiianNavajoNepaleseNew ZealanderNicaraguanNigerianNorthern EuropeanNorwegianOkinawanOsageOttawaPaiutePakistaniPalestinianPanamanianParaguayanPennsylvania GermanPeruvianPimaPolishPortuguesePotawatomiPuebloPuerto RicanPuget Sound SalishRomanianRussianSalvadoranSamoanScandinavianScotch-IrishScottishSeminoleSenegaleseSerbianShoshoneSierra LeoneanSiouxSlavicSlovakSloveneSomaliSouth AfricanSouth AmericanSouth American IndianSoviet UnionSpaniardSpanishSpanish AmericanSpanish American IndianSri LankanSubsaharan AfricanSudaneseSwedishSwissSyrianTaiwaneseThaiTlingit-HaidaTohono O'OdhamTonganTrinidadian and TobagonianTsimshianTurkishU.S. Virgin IslanderUgandanUkrainianUruguayanUteVenezuelanVietnameseWelshWest IndianYakamaYaquiYugoslavianYumanYup'ikZimbabwean
Immigration
NonimmigrantsImmigrantsAfghanistanAfricaAlbaniaArgentinaArmeniaAsiaAustraliaAustriaBahamasBangladeshBarbadosBelarusBelgiumBelizeBoliviaBosnia and HerzegovinaBrazilBulgariaBurma/MyanmarCabo VerdeCambodiaCameroonCanadaCaribbeanCentral AmericaChileChinaColombiaCongoCosta RicaCroatiaCubaCzechoslovakiaDenmarkDominicaDominican RepublicEastern AfricaEastern AsiaEastern EuropeEcuadorEgyptEl SalvadorEnglandEritreaEthiopiaFijiFranceGermanyGhanaGreeceGrenadaGuatemalaGuyanaHaitiHondurasHong KongHungaryIndiaIndonesiaIranIraqIrelandIsraelItalyJamaicaJapanJordanKazakhstanKenyaKoreaKuwaitLaosLatin AmericaLatviaLebanonLiberiaLithuaniaMalaysiaMexicoMicronesiaMiddle AfricaMoldovaMoroccoNepalNetherlandsNicaraguaNigeriaNorth AmericaNorth MacedoniaNorthern AfricaNorthern EuropeNorwayOceaniaPakistanPanamaPeruPhilippinesPolandPortugalRomaniaRussiaSaudi ArabiaScotlandSenegalSerbiaSierra LeoneSingaporeSomaliaSouth AfricaSouth AmericaSouth Central AsiaSouth Eastern AsiaSouthern EuropeSpainSri LankaSt. Vincent and the GrenadinesSudanSwedenSwitzerlandSyriaTaiwanThailandTrinidad and TobagoTurkeyUgandaUkraineUruguayUzbekistanVenezuelaVietnamWest IndiesWestern AfricaWestern AsiaWestern EuropeYemenZaireZimbabweAzores
Immigrants from Europe
Race
Ancestry
AfghanAfricanAlaska NativeAlaskan AthabascanAlbanianAleutAlsatianAmericanApacheArabArapahoArgentineanArmenianAssyrian/Chaldean/SyriacAustralianAustrianBahamianBangladeshiBarbadianBasqueBelgianBelizeanBermudanBhutaneseBlackfeetBolivianBrazilianBritishBritish West IndianBulgarianBurmeseCajunCambodianCanadianCape VerdeanCarpatho RusynCelticCentral AmericanCentral American IndianCherokeeCheyenneChickasawChileanChineseChippewaChoctawColombianColvilleCosta RicanCreeCreekCroatianCrowCubanCypriotCzechCzechoslovakianDanishDelawareDominicanDutchDutch West IndianEastern EuropeanEcuadorianEgyptianEnglishEstonianEthiopianEuropeanFijianFilipinoFinnishFrenchFrench American IndianFrench CanadianGermanGerman RussianGhanaianGreekGuamanian/ChamorroGuatemalanGuyaneseHaitianHmongHonduranHopiHoumaHungarianIcelanderIndian (Asian)IndonesianInupiatIranianIraqiIrishIroquoisIsraeliItalianJamaicanJapaneseJordanianKenyanKiowaKoreanLaotianLatvianLebaneseLiberianLithuanianLumbeeLuxembourgerMacedonianMalaysianMalteseMarshalleseMenomineeMexicanMexican American IndianMongolianMoroccanNative HawaiianNavajoNepaleseNew ZealanderNicaraguanNigerianNorthern EuropeanNorwegianOkinawanOsageOttawaPaiutePakistaniPalestinianPanamanianParaguayanPennsylvania GermanPeruvianPimaPolishPortuguesePotawatomiPuebloPuerto RicanPuget Sound SalishRomanianRussianSalvadoranSamoanScandinavianScotch-IrishScottishSeminoleSenegaleseSerbianShoshoneSierra LeoneanSiouxSlavicSlovakSloveneSomaliSouth AfricanSouth AmericanSouth American IndianSoviet UnionSpaniardSpanishSpanish AmericanSpanish American IndianSri LankanSubsaharan AfricanSudaneseSwedishSwissSyrianTaiwaneseThaiTlingit-HaidaTohono O'OdhamTonganTrinidadian and TobagonianTsimshianTurkishU.S. Virgin IslanderUgandanUkrainianUruguayanUteVenezuelanVietnameseWelshWest IndianYakamaYaquiYugoslavianYumanYup'ikZimbabwean
Immigration
NonimmigrantsImmigrantsAfghanistanAfricaAlbaniaArgentinaArmeniaAsiaAustraliaAustriaBahamasBangladeshBarbadosBelarusBelgiumBelizeBoliviaBosnia and HerzegovinaBrazilBulgariaBurma/MyanmarCabo VerdeCambodiaCameroonCanadaCaribbeanCentral AmericaChileChinaColombiaCongoCosta RicaCroatiaCubaCzechoslovakiaDenmarkDominicaDominican RepublicEastern AfricaEastern AsiaEastern EuropeEcuadorEgyptEl SalvadorEnglandEritreaEthiopiaEuropeFijiFranceGermanyGhanaGreeceGrenadaGuatemalaGuyanaHaitiHondurasHong KongHungaryIndiaIndonesiaIranIraqIrelandIsraelItalyJamaicaJapanJordanKazakhstanKenyaKoreaKuwaitLaosLatin AmericaLatviaLebanonLiberiaLithuaniaMalaysiaMexicoMicronesiaMiddle AfricaMoldovaMoroccoNepalNetherlandsNicaraguaNigeriaNorth AmericaNorth MacedoniaNorthern AfricaNorthern EuropeNorwayOceaniaPakistanPanamaPeruPhilippinesPolandPortugalRomaniaRussiaSaudi ArabiaScotlandSenegalSerbiaSierra LeoneSingaporeSomaliaSouth AfricaSouth AmericaSouth Central AsiaSouth Eastern AsiaSouthern EuropeSpainSri LankaSt. Vincent and the GrenadinesSudanSwedenSwitzerlandSyriaTaiwanThailandTrinidad and TobagoTurkeyUgandaUkraineUruguayUzbekistanVenezuelaVietnamWest IndiesWestern AfricaWestern AsiaWestern EuropeYemenZaireZimbabweAzores
College, 1 year or more
Income
Poverty
Unemployment
Labor Participation
Family Structure
Vehicle Availability
Education Level
Disability

College, 1 year or more Comparison

Comanche

Immigrants from Europe

Tragic
Exceptional
54.4%
COLLEGE, 1 YEAR OR MORE
0.2/ 100
METRIC RATING
272nd/ 347
METRIC RANK
63.3%
COLLEGE, 1 YEAR OR MORE
99.3/ 100
METRIC RATING
66th/ 347
METRIC RANK

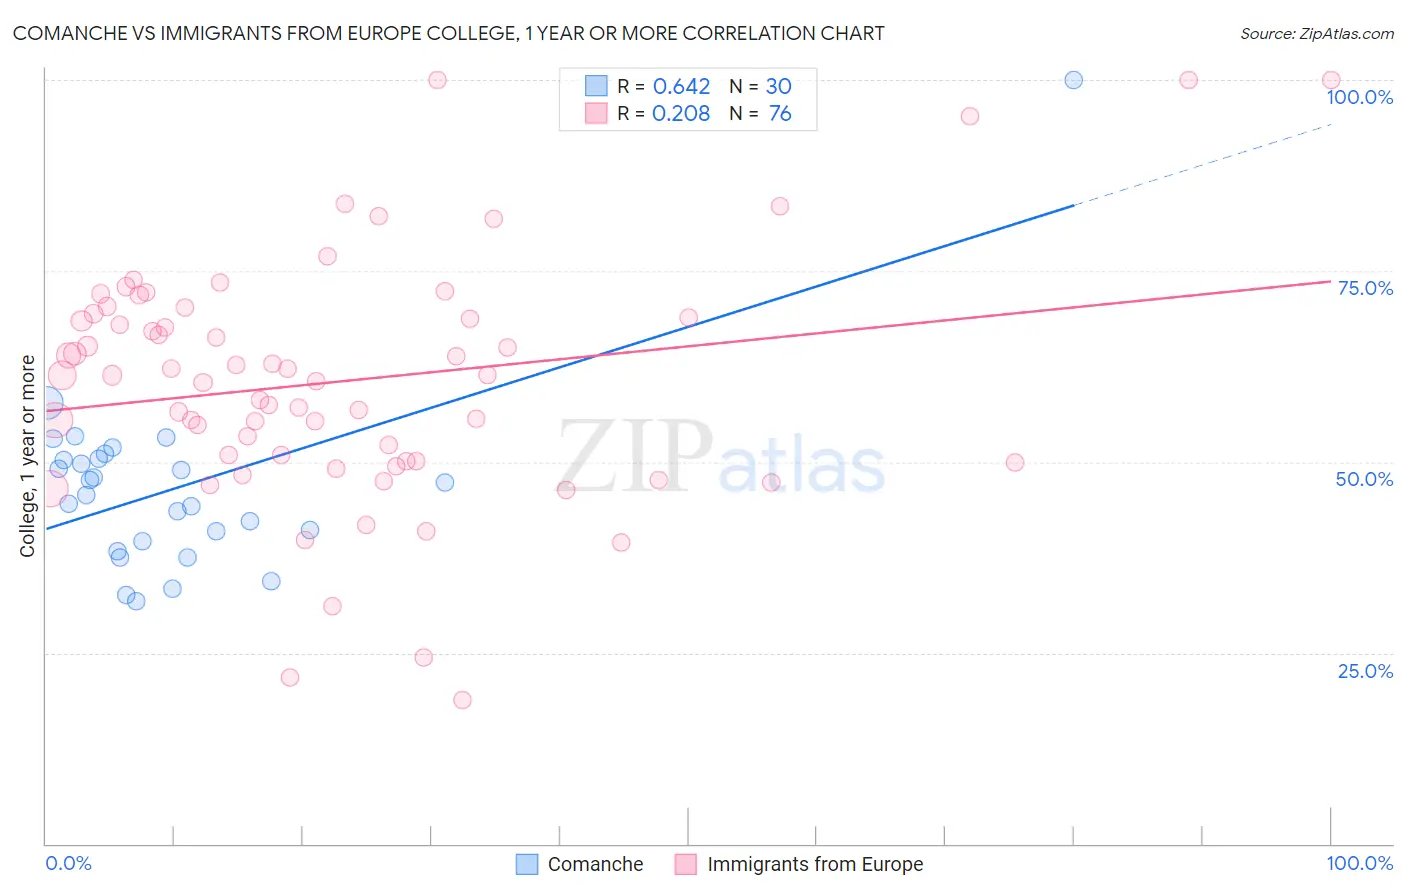
Comanche vs Immigrants from Europe College, 1 year or more Correlation Chart

The statistical analysis conducted on geographies consisting of 109,786,512 people shows a significant positive correlation between the proportion of Comanche and percentage of population with at least college, 1 year or more education in the United States with a correlation coefficient (R) of 0.642 and weighted average of 54.4%. Similarly, the statistical analysis conducted on geographies consisting of 547,418,471 people shows a weak positive correlation between the proportion of Immigrants from Europe and percentage of population with at least college, 1 year or more education in the United States with a correlation coefficient (R) of 0.208 and weighted average of 63.3%, a difference of 16.2%.
Comanche vs Immigrants from Europe College, 1 year or more

College, 1 year or more Correlation Summary

MeasurementComancheImmigrants from Europe
Minimum31.7%18.8%
Maximum100.0%100.0%
Range68.3%81.2%
Mean46.6%60.6%
Median46.5%61.4%
Interquartile 25% (IQ1)39.6%50.0%
Interquartile 75% (IQ3)50.4%69.1%
Interquartile Range (IQR)10.8%19.1%
Standard Deviation (Sample)12.2%16.1%
Standard Deviation (Population)12.0%15.9%

Similar Demographics by College, 1 year or more

Demographics Similar to Comanche by College, 1 year or more

In terms of college, 1 year or more, the demographic groups most similar to Comanche are Immigrants from Grenada (54.4%, a difference of 0.040%), Bahamian (54.5%, a difference of 0.050%), Crow (54.5%, a difference of 0.070%), Belizean (54.4%, a difference of 0.080%), and Bangladeshi (54.5%, a difference of 0.10%).
DemographicsRating | RankCollege, 1 year or more
Immigrants | Laos
0.2
/100
|
#265
Tragic
54.7%
Potawatomi
0.2
/100
|
#266
Tragic
54.6%
Blackfeet
0.2
/100
|
#267
Tragic
54.6%
British West Indians
0.2
/100
|
#268
Tragic
54.5%
Bangladeshis
0.2
/100
|
#269
Tragic
54.5%
Crow
0.2
/100
|
#270
Tragic
54.5%
Bahamians
0.2
/100
|
#271
Tragic
54.5%
Comanche
0.2
/100
|
#272
Tragic
54.4%
Immigrants | Grenada
0.2
/100
|
#273
Tragic
54.4%
Belizeans
0.2
/100
|
#274
Tragic
54.4%
Americans
0.2
/100
|
#275
Tragic
54.4%
Shoshone
0.2
/100
|
#276
Tragic
54.3%
Ecuadorians
0.2
/100
|
#277
Tragic
54.3%
Immigrants | Jamaica
0.1
/100
|
#278
Tragic
54.2%
Arapaho
0.1
/100
|
#279
Tragic
54.1%

Demographics Similar to Immigrants from Europe by College, 1 year or more

In terms of college, 1 year or more, the demographic groups most similar to Immigrants from Europe are Immigrants from Romania (63.3%, a difference of 0.020%), Immigrants from Greece (63.3%, a difference of 0.030%), Immigrants from Zimbabwe (63.3%, a difference of 0.040%), Maltese (63.4%, a difference of 0.10%), and Argentinean (63.2%, a difference of 0.13%).
DemographicsRating | RankCollege, 1 year or more
Immigrants | Serbia
99.6
/100
|
#59
Exceptional
63.8%
Immigrants | Kazakhstan
99.5
/100
|
#60
Exceptional
63.6%
Bolivians
99.5
/100
|
#61
Exceptional
63.5%
Immigrants | Indonesia
99.5
/100
|
#62
Exceptional
63.5%
Immigrants | Scotland
99.4
/100
|
#63
Exceptional
63.4%
Immigrants | Spain
99.4
/100
|
#64
Exceptional
63.4%
Maltese
99.3
/100
|
#65
Exceptional
63.4%
Immigrants | Europe
99.3
/100
|
#66
Exceptional
63.3%
Immigrants | Romania
99.3
/100
|
#67
Exceptional
63.3%
Immigrants | Greece
99.3
/100
|
#68
Exceptional
63.3%
Immigrants | Zimbabwe
99.3
/100
|
#69
Exceptional
63.3%
Argentineans
99.2
/100
|
#70
Exceptional
63.2%
Immigrants | Canada
99.1
/100
|
#71
Exceptional
63.1%
Egyptians
99.0
/100
|
#72
Exceptional
63.1%
Immigrants | Moldova
99.0
/100
|
#73
Exceptional
63.0%