Subsaharan African vs Scottish Disability Age Over 75
COMPARE
Subsaharan African
Scottish
Disability Age Over 75
Disability Age Over 75 Comparison
Sub-Saharan Africans
Scottish
48.2%
DISABILITY AGE OVER 75
3.8/ 100
METRIC RATING
234th/ 347
METRIC RANK
46.7%
DISABILITY AGE OVER 75
90.5/ 100
METRIC RATING
131st/ 347
METRIC RANK
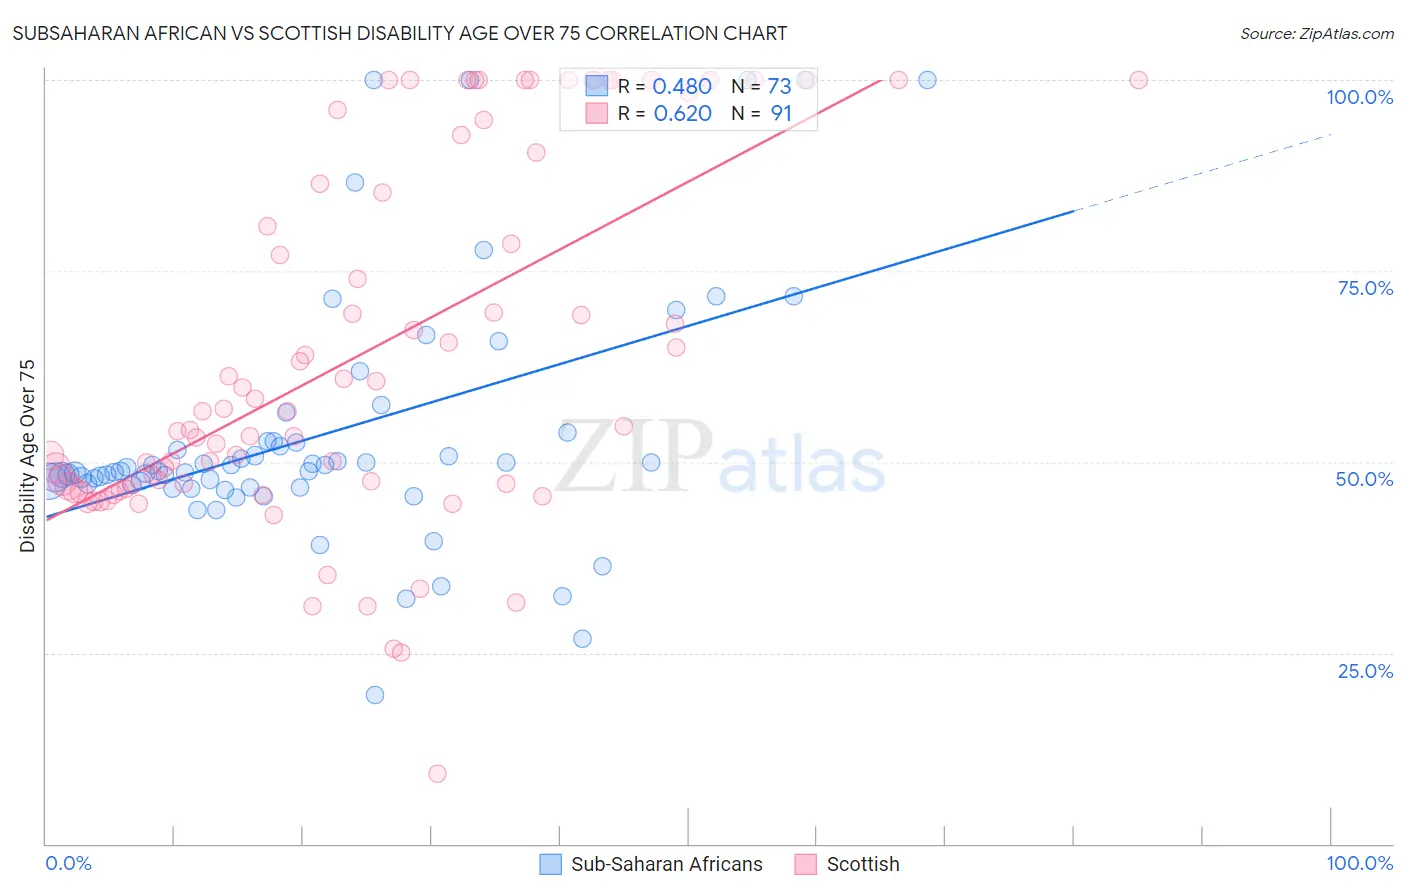
Subsaharan African vs Scottish Disability Age Over 75 Correlation Chart
The statistical analysis conducted on geographies consisting of 506,598,024 people shows a moderate positive correlation between the proportion of Sub-Saharan Africans and percentage of population with a disability over the age of 75 in the United States with a correlation coefficient (R) of 0.480 and weighted average of 48.2%. Similarly, the statistical analysis conducted on geographies consisting of 565,035,071 people shows a significant positive correlation between the proportion of Scottish and percentage of population with a disability over the age of 75 in the United States with a correlation coefficient (R) of 0.620 and weighted average of 46.7%, a difference of 3.1%.
Disability Age Over 75 Correlation Summary
| Measurement | Subsaharan African | Scottish |
| Minimum | 19.4% | 9.1% |
| Maximum | 100.0% | 100.0% |
| Range | 80.6% | 90.9% |
| Mean | 53.4% | 64.1% |
| Median | 48.8% | 56.7% |
| Interquartile 25% (IQ1) | 46.9% | 46.8% |
| Interquartile 75% (IQ3) | 52.7% | 90.5% |
| Interquartile Range (IQR) | 5.8% | 43.6% |
| Standard Deviation (Sample) | 16.4% | 23.7% |
| Standard Deviation (Population) | 16.3% | 23.6% |
Similar Demographics by Disability Age Over 75
Demographics Similar to Sub-Saharan Africans by Disability Age Over 75
In terms of disability age over 75, the demographic groups most similar to Sub-Saharan Africans are Hmong (48.2%, a difference of 0.0%), Indonesian (48.2%, a difference of 0.060%), Cree (48.2%, a difference of 0.060%), Immigrants (48.2%, a difference of 0.080%), and Taiwanese (48.2%, a difference of 0.090%).
| Demographics | Rating | Rank | Disability Age Over 75 |
| Zimbabweans | 6.4 /100 | #227 | Tragic 48.1% |
| Immigrants | Liberia | 5.9 /100 | #228 | Tragic 48.1% |
| Spaniards | 5.7 /100 | #229 | Tragic 48.1% |
| Taiwanese | 4.4 /100 | #230 | Tragic 48.2% |
| Immigrants | Immigrants | 4.3 /100 | #231 | Tragic 48.2% |
| Indonesians | 4.2 /100 | #232 | Tragic 48.2% |
| Cree | 4.2 /100 | #233 | Tragic 48.2% |
| Sub-Saharan Africans | 3.8 /100 | #234 | Tragic 48.2% |
| Hmong | 3.8 /100 | #235 | Tragic 48.2% |
| Immigrants | Nicaragua | 3.2 /100 | #236 | Tragic 48.2% |
| Immigrants | St. Vincent and the Grenadines | 3.2 /100 | #237 | Tragic 48.2% |
| Nicaraguans | 3.0 /100 | #238 | Tragic 48.3% |
| Immigrants | Thailand | 2.8 /100 | #239 | Tragic 48.3% |
| Tongans | 2.3 /100 | #240 | Tragic 48.3% |
| Native Hawaiians | 2.2 /100 | #241 | Tragic 48.3% |
Demographics Similar to Scottish by Disability Age Over 75
In terms of disability age over 75, the demographic groups most similar to Scottish are Immigrants from Northern Africa (46.7%, a difference of 0.010%), Immigrants from Germany (46.7%, a difference of 0.020%), Icelander (46.7%, a difference of 0.030%), South American (46.8%, a difference of 0.030%), and Syrian (46.7%, a difference of 0.040%).
| Demographics | Rating | Rank | Disability Age Over 75 |
| Immigrants | South America | 91.8 /100 | #124 | Exceptional 46.7% |
| Colombians | 91.3 /100 | #125 | Exceptional 46.7% |
| Europeans | 91.2 /100 | #126 | Exceptional 46.7% |
| Syrians | 91.1 /100 | #127 | Exceptional 46.7% |
| Icelanders | 90.9 /100 | #128 | Exceptional 46.7% |
| Immigrants | Germany | 90.8 /100 | #129 | Exceptional 46.7% |
| Immigrants | Northern Africa | 90.7 /100 | #130 | Exceptional 46.7% |
| Scottish | 90.5 /100 | #131 | Exceptional 46.7% |
| South Americans | 90.0 /100 | #132 | Excellent 46.8% |
| English | 89.4 /100 | #133 | Excellent 46.8% |
| Immigrants | Ethiopia | 89.1 /100 | #134 | Excellent 46.8% |
| Ethiopians | 88.9 /100 | #135 | Excellent 46.8% |
| Immigrants | Venezuela | 88.6 /100 | #136 | Excellent 46.8% |
| Immigrants | Uganda | 88.5 /100 | #137 | Excellent 46.8% |
| Immigrants | Bosnia and Herzegovina | 88.5 /100 | #138 | Excellent 46.8% |