Subsaharan African vs Chilean Disability Age Over 75
COMPARE
Subsaharan African
Chilean
Disability Age Over 75
Disability Age Over 75 Comparison
Sub-Saharan Africans
Chileans
48.2%
DISABILITY AGE OVER 75
3.8/ 100
METRIC RATING
234th/ 347
METRIC RANK
46.5%
DISABILITY AGE OVER 75
96.4/ 100
METRIC RATING
109th/ 347
METRIC RANK
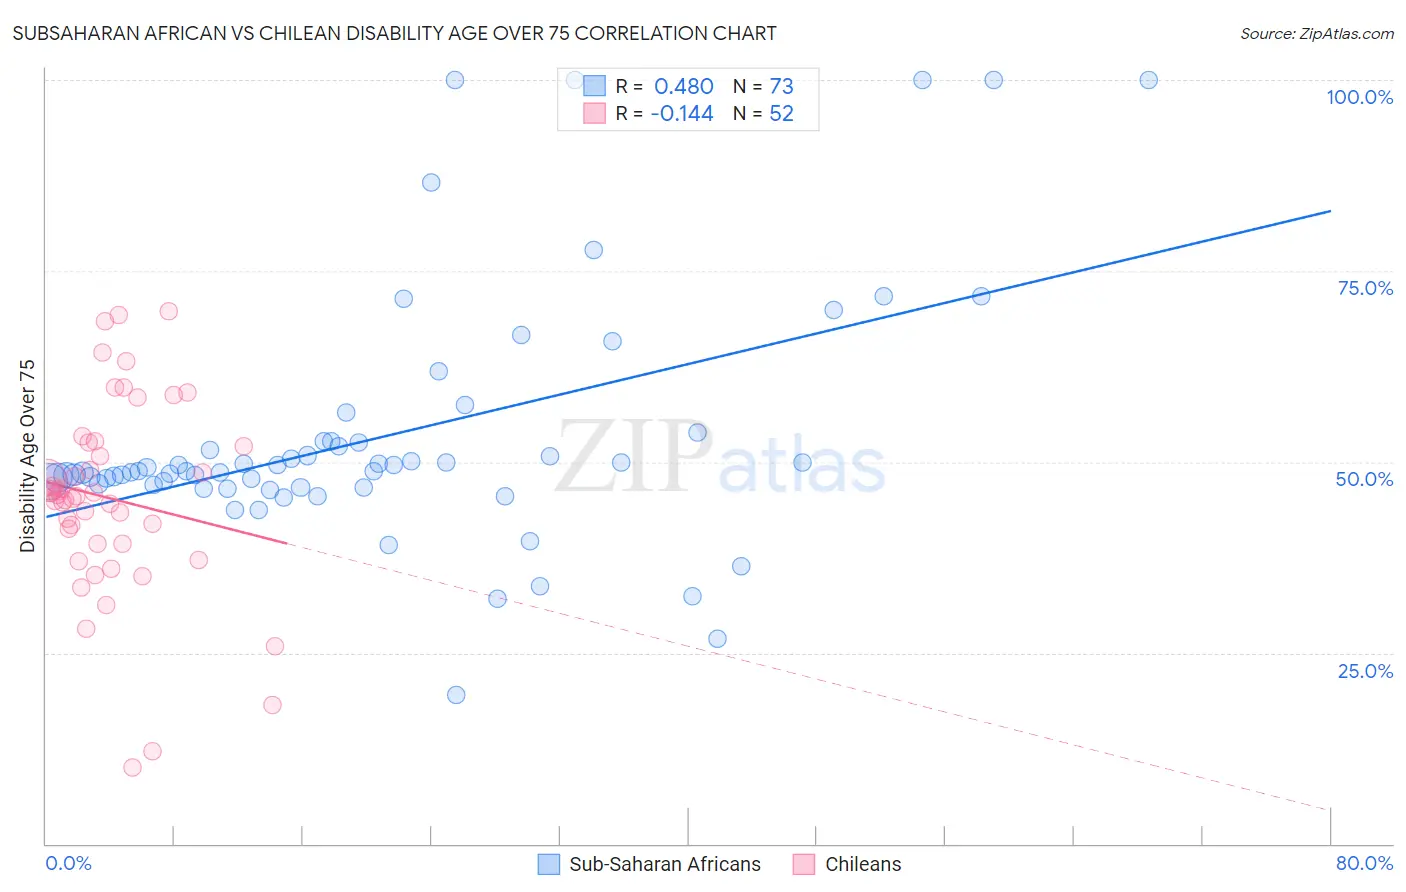
Subsaharan African vs Chilean Disability Age Over 75 Correlation Chart
The statistical analysis conducted on geographies consisting of 506,598,024 people shows a moderate positive correlation between the proportion of Sub-Saharan Africans and percentage of population with a disability over the age of 75 in the United States with a correlation coefficient (R) of 0.480 and weighted average of 48.2%. Similarly, the statistical analysis conducted on geographies consisting of 256,435,709 people shows a poor negative correlation between the proportion of Chileans and percentage of population with a disability over the age of 75 in the United States with a correlation coefficient (R) of -0.144 and weighted average of 46.5%, a difference of 3.7%.
Disability Age Over 75 Correlation Summary
| Measurement | Subsaharan African | Chilean |
| Minimum | 19.4% | 10.0% |
| Maximum | 100.0% | 69.8% |
| Range | 80.6% | 59.8% |
| Mean | 53.4% | 45.2% |
| Median | 48.8% | 45.6% |
| Interquartile 25% (IQ1) | 46.9% | 39.3% |
| Interquartile 75% (IQ3) | 52.7% | 52.3% |
| Interquartile Range (IQR) | 5.8% | 13.1% |
| Standard Deviation (Sample) | 16.4% | 12.7% |
| Standard Deviation (Population) | 16.3% | 12.6% |
Similar Demographics by Disability Age Over 75
Demographics Similar to Sub-Saharan Africans by Disability Age Over 75
In terms of disability age over 75, the demographic groups most similar to Sub-Saharan Africans are Hmong (48.2%, a difference of 0.0%), Indonesian (48.2%, a difference of 0.060%), Cree (48.2%, a difference of 0.060%), Immigrants (48.2%, a difference of 0.080%), and Taiwanese (48.2%, a difference of 0.090%).
| Demographics | Rating | Rank | Disability Age Over 75 |
| Zimbabweans | 6.4 /100 | #227 | Tragic 48.1% |
| Immigrants | Liberia | 5.9 /100 | #228 | Tragic 48.1% |
| Spaniards | 5.7 /100 | #229 | Tragic 48.1% |
| Taiwanese | 4.4 /100 | #230 | Tragic 48.2% |
| Immigrants | Immigrants | 4.3 /100 | #231 | Tragic 48.2% |
| Indonesians | 4.2 /100 | #232 | Tragic 48.2% |
| Cree | 4.2 /100 | #233 | Tragic 48.2% |
| Sub-Saharan Africans | 3.8 /100 | #234 | Tragic 48.2% |
| Hmong | 3.8 /100 | #235 | Tragic 48.2% |
| Immigrants | Nicaragua | 3.2 /100 | #236 | Tragic 48.2% |
| Immigrants | St. Vincent and the Grenadines | 3.2 /100 | #237 | Tragic 48.2% |
| Nicaraguans | 3.0 /100 | #238 | Tragic 48.3% |
| Immigrants | Thailand | 2.8 /100 | #239 | Tragic 48.3% |
| Tongans | 2.3 /100 | #240 | Tragic 48.3% |
| Native Hawaiians | 2.2 /100 | #241 | Tragic 48.3% |
Demographics Similar to Chileans by Disability Age Over 75
In terms of disability age over 75, the demographic groups most similar to Chileans are Immigrants from Hong Kong (46.5%, a difference of 0.010%), Immigrants from Chile (46.5%, a difference of 0.010%), Brazilian (46.5%, a difference of 0.030%), Immigrants from Uruguay (46.4%, a difference of 0.040%), and Immigrants from Pakistan (46.5%, a difference of 0.050%).
| Demographics | Rating | Rank | Disability Age Over 75 |
| Immigrants | Malaysia | 97.1 /100 | #102 | Exceptional 46.4% |
| Ukrainians | 97.1 /100 | #103 | Exceptional 46.4% |
| Israelis | 97.0 /100 | #104 | Exceptional 46.4% |
| Immigrants | Cameroon | 96.9 /100 | #105 | Exceptional 46.4% |
| Immigrants | Kuwait | 96.8 /100 | #106 | Exceptional 46.4% |
| Immigrants | Uruguay | 96.7 /100 | #107 | Exceptional 46.4% |
| Brazilians | 96.6 /100 | #108 | Exceptional 46.5% |
| Chileans | 96.4 /100 | #109 | Exceptional 46.5% |
| Immigrants | Hong Kong | 96.4 /100 | #110 | Exceptional 46.5% |
| Immigrants | Chile | 96.4 /100 | #111 | Exceptional 46.5% |
| Immigrants | Pakistan | 96.1 /100 | #112 | Exceptional 46.5% |
| Irish | 96.0 /100 | #113 | Exceptional 46.5% |
| Dutch | 95.9 /100 | #114 | Exceptional 46.5% |
| British | 95.7 /100 | #115 | Exceptional 46.5% |
| Indians (Asian) | 95.7 /100 | #116 | Exceptional 46.5% |