Subsaharan African vs Hungarian Disability Age Over 75
COMPARE
Subsaharan African
Hungarian
Disability Age Over 75
Disability Age Over 75 Comparison
Sub-Saharan Africans
Hungarians
48.2%
DISABILITY AGE OVER 75
3.8/ 100
METRIC RATING
234th/ 347
METRIC RANK
46.5%
DISABILITY AGE OVER 75
95.3/ 100
METRIC RATING
117th/ 347
METRIC RANK
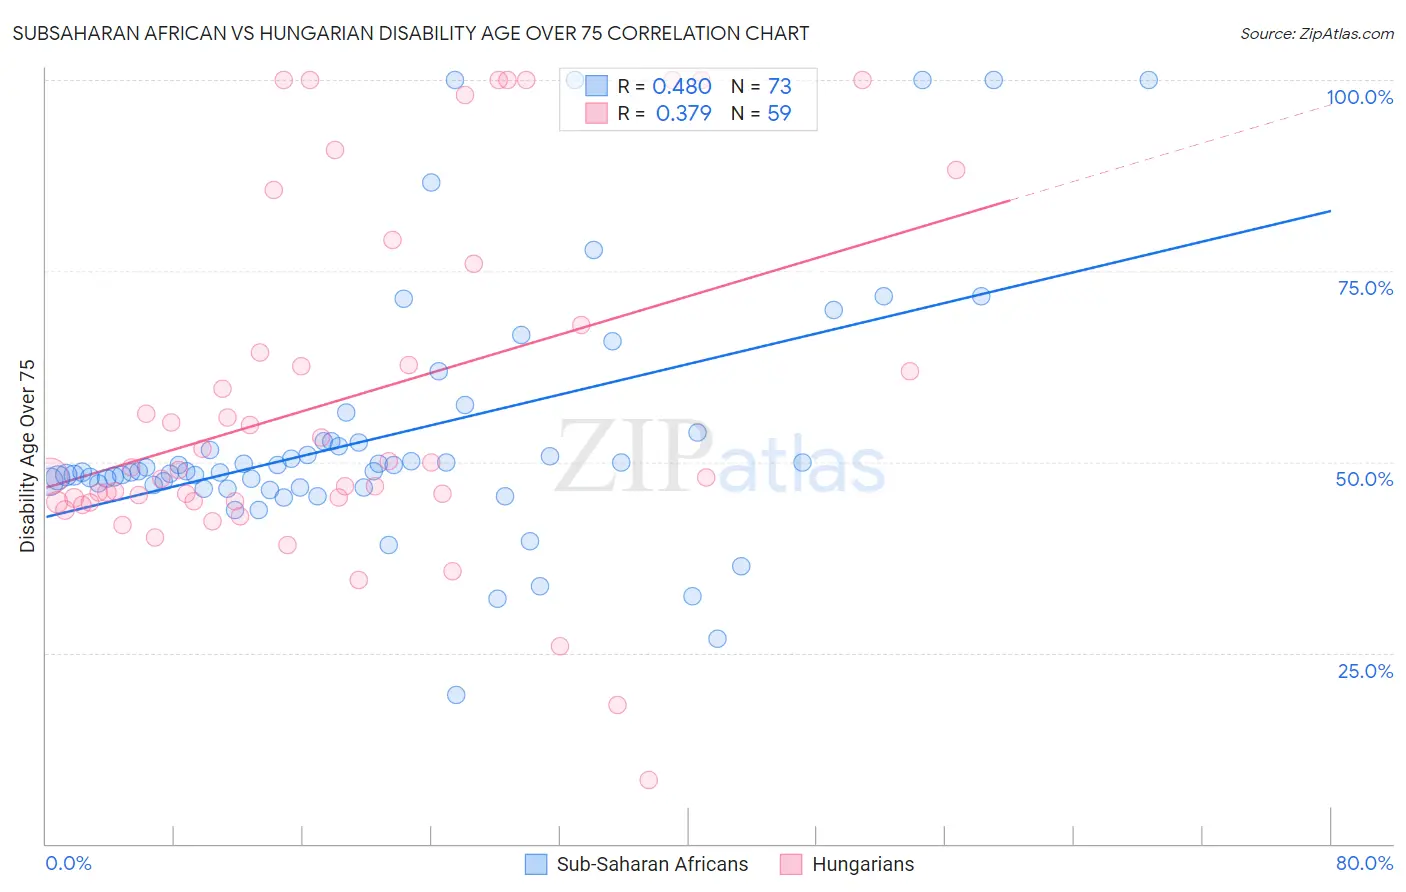
Subsaharan African vs Hungarian Disability Age Over 75 Correlation Chart
The statistical analysis conducted on geographies consisting of 506,598,024 people shows a moderate positive correlation between the proportion of Sub-Saharan Africans and percentage of population with a disability over the age of 75 in the United States with a correlation coefficient (R) of 0.480 and weighted average of 48.2%. Similarly, the statistical analysis conducted on geographies consisting of 485,150,017 people shows a mild positive correlation between the proportion of Hungarians and percentage of population with a disability over the age of 75 in the United States with a correlation coefficient (R) of 0.379 and weighted average of 46.5%, a difference of 3.6%.
Disability Age Over 75 Correlation Summary
| Measurement | Subsaharan African | Hungarian |
| Minimum | 19.4% | 8.3% |
| Maximum | 100.0% | 100.0% |
| Range | 80.6% | 91.7% |
| Mean | 53.4% | 58.0% |
| Median | 48.8% | 48.9% |
| Interquartile 25% (IQ1) | 46.9% | 44.8% |
| Interquartile 75% (IQ3) | 52.7% | 67.9% |
| Interquartile Range (IQR) | 5.8% | 23.1% |
| Standard Deviation (Sample) | 16.4% | 22.8% |
| Standard Deviation (Population) | 16.3% | 22.6% |
Similar Demographics by Disability Age Over 75
Demographics Similar to Sub-Saharan Africans by Disability Age Over 75
In terms of disability age over 75, the demographic groups most similar to Sub-Saharan Africans are Hmong (48.2%, a difference of 0.0%), Indonesian (48.2%, a difference of 0.060%), Cree (48.2%, a difference of 0.060%), Immigrants (48.2%, a difference of 0.080%), and Taiwanese (48.2%, a difference of 0.090%).
| Demographics | Rating | Rank | Disability Age Over 75 |
| Zimbabweans | 6.4 /100 | #227 | Tragic 48.1% |
| Immigrants | Liberia | 5.9 /100 | #228 | Tragic 48.1% |
| Spaniards | 5.7 /100 | #229 | Tragic 48.1% |
| Taiwanese | 4.4 /100 | #230 | Tragic 48.2% |
| Immigrants | Immigrants | 4.3 /100 | #231 | Tragic 48.2% |
| Indonesians | 4.2 /100 | #232 | Tragic 48.2% |
| Cree | 4.2 /100 | #233 | Tragic 48.2% |
| Sub-Saharan Africans | 3.8 /100 | #234 | Tragic 48.2% |
| Hmong | 3.8 /100 | #235 | Tragic 48.2% |
| Immigrants | Nicaragua | 3.2 /100 | #236 | Tragic 48.2% |
| Immigrants | St. Vincent and the Grenadines | 3.2 /100 | #237 | Tragic 48.2% |
| Nicaraguans | 3.0 /100 | #238 | Tragic 48.3% |
| Immigrants | Thailand | 2.8 /100 | #239 | Tragic 48.3% |
| Tongans | 2.3 /100 | #240 | Tragic 48.3% |
| Native Hawaiians | 2.2 /100 | #241 | Tragic 48.3% |
Demographics Similar to Hungarians by Disability Age Over 75
In terms of disability age over 75, the demographic groups most similar to Hungarians are British (46.5%, a difference of 0.060%), Indian (Asian) (46.5%, a difference of 0.060%), Dutch (46.5%, a difference of 0.080%), Czechoslovakian (46.6%, a difference of 0.080%), and Irish (46.5%, a difference of 0.10%).
| Demographics | Rating | Rank | Disability Age Over 75 |
| Immigrants | Hong Kong | 96.4 /100 | #110 | Exceptional 46.5% |
| Immigrants | Chile | 96.4 /100 | #111 | Exceptional 46.5% |
| Immigrants | Pakistan | 96.1 /100 | #112 | Exceptional 46.5% |
| Irish | 96.0 /100 | #113 | Exceptional 46.5% |
| Dutch | 95.9 /100 | #114 | Exceptional 46.5% |
| British | 95.7 /100 | #115 | Exceptional 46.5% |
| Indians (Asian) | 95.7 /100 | #116 | Exceptional 46.5% |
| Hungarians | 95.3 /100 | #117 | Exceptional 46.5% |
| Czechoslovakians | 94.7 /100 | #118 | Exceptional 46.6% |
| Canadians | 94.4 /100 | #119 | Exceptional 46.6% |
| Immigrants | Nepal | 94.1 /100 | #120 | Exceptional 46.6% |
| Scandinavians | 93.6 /100 | #121 | Exceptional 46.6% |
| Immigrants | Albania | 93.2 /100 | #122 | Exceptional 46.6% |
| Immigrants | Colombia | 92.6 /100 | #123 | Exceptional 46.7% |
| Immigrants | South America | 91.8 /100 | #124 | Exceptional 46.7% |