Subsaharan African vs Immigrants from Austria Disability Age Over 75
COMPARE
Subsaharan African
Immigrants from Austria
Disability Age Over 75
Disability Age Over 75 Comparison
Sub-Saharan Africans
Immigrants from Austria
48.2%
DISABILITY AGE OVER 75
3.8/ 100
METRIC RATING
234th/ 347
METRIC RANK
44.9%
DISABILITY AGE OVER 75
100.0/ 100
METRIC RATING
8th/ 347
METRIC RANK
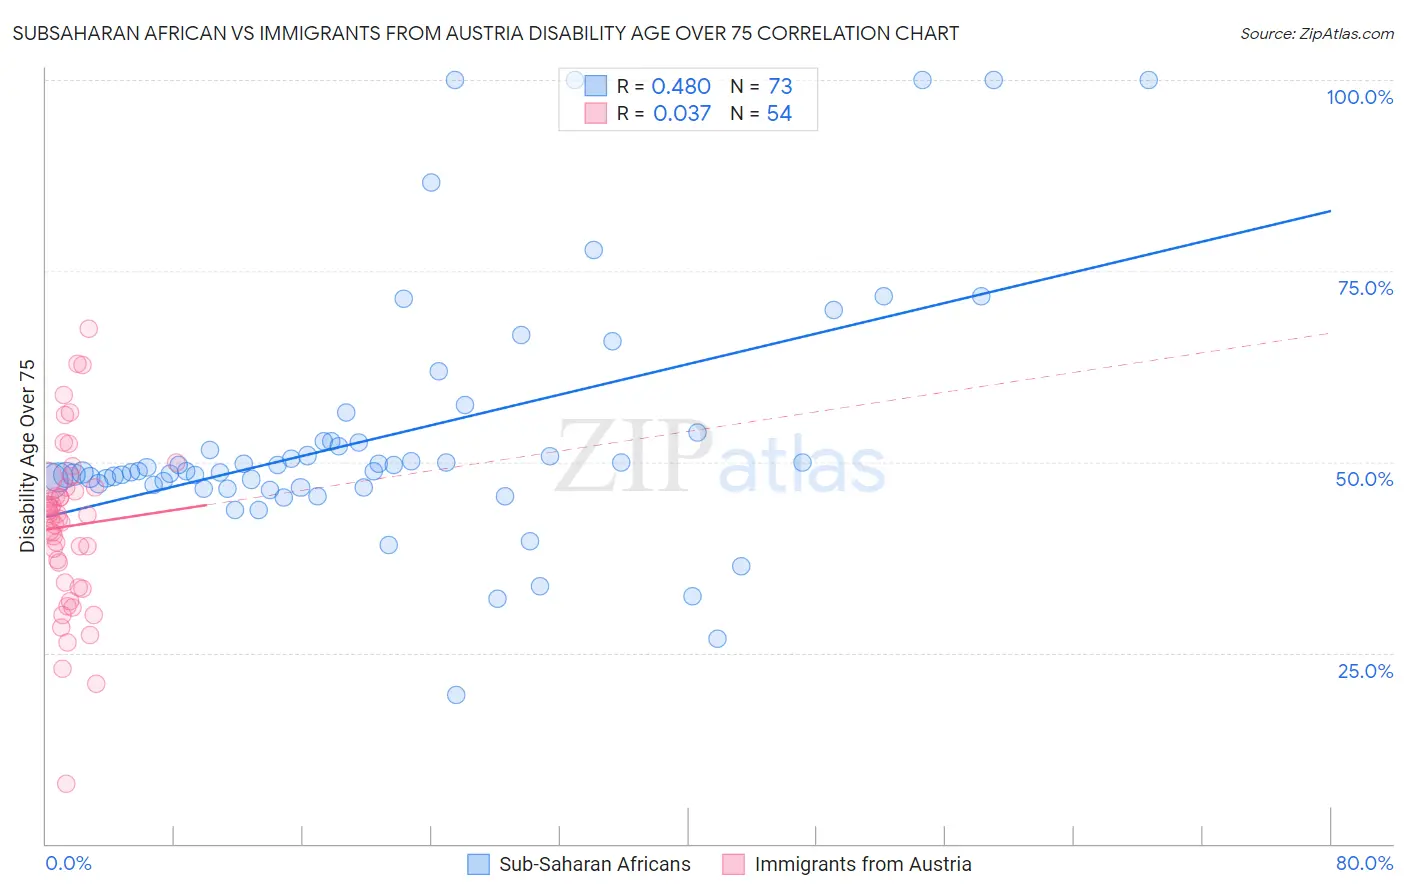
Subsaharan African vs Immigrants from Austria Disability Age Over 75 Correlation Chart
The statistical analysis conducted on geographies consisting of 506,598,024 people shows a moderate positive correlation between the proportion of Sub-Saharan Africans and percentage of population with a disability over the age of 75 in the United States with a correlation coefficient (R) of 0.480 and weighted average of 48.2%. Similarly, the statistical analysis conducted on geographies consisting of 167,936,864 people shows no correlation between the proportion of Immigrants from Austria and percentage of population with a disability over the age of 75 in the United States with a correlation coefficient (R) of 0.037 and weighted average of 44.9%, a difference of 7.2%.
Disability Age Over 75 Correlation Summary
| Measurement | Subsaharan African | Immigrants from Austria |
| Minimum | 19.4% | 7.8% |
| Maximum | 100.0% | 67.5% |
| Range | 80.6% | 59.7% |
| Mean | 53.4% | 41.6% |
| Median | 48.8% | 42.8% |
| Interquartile 25% (IQ1) | 46.9% | 34.2% |
| Interquartile 75% (IQ3) | 52.7% | 46.7% |
| Interquartile Range (IQR) | 5.8% | 12.5% |
| Standard Deviation (Sample) | 16.4% | 10.9% |
| Standard Deviation (Population) | 16.3% | 10.8% |
Similar Demographics by Disability Age Over 75
Demographics Similar to Sub-Saharan Africans by Disability Age Over 75
In terms of disability age over 75, the demographic groups most similar to Sub-Saharan Africans are Hmong (48.2%, a difference of 0.0%), Indonesian (48.2%, a difference of 0.060%), Cree (48.2%, a difference of 0.060%), Immigrants (48.2%, a difference of 0.080%), and Taiwanese (48.2%, a difference of 0.090%).
| Demographics | Rating | Rank | Disability Age Over 75 |
| Zimbabweans | 6.4 /100 | #227 | Tragic 48.1% |
| Immigrants | Liberia | 5.9 /100 | #228 | Tragic 48.1% |
| Spaniards | 5.7 /100 | #229 | Tragic 48.1% |
| Taiwanese | 4.4 /100 | #230 | Tragic 48.2% |
| Immigrants | Immigrants | 4.3 /100 | #231 | Tragic 48.2% |
| Indonesians | 4.2 /100 | #232 | Tragic 48.2% |
| Cree | 4.2 /100 | #233 | Tragic 48.2% |
| Sub-Saharan Africans | 3.8 /100 | #234 | Tragic 48.2% |
| Hmong | 3.8 /100 | #235 | Tragic 48.2% |
| Immigrants | Nicaragua | 3.2 /100 | #236 | Tragic 48.2% |
| Immigrants | St. Vincent and the Grenadines | 3.2 /100 | #237 | Tragic 48.2% |
| Nicaraguans | 3.0 /100 | #238 | Tragic 48.3% |
| Immigrants | Thailand | 2.8 /100 | #239 | Tragic 48.3% |
| Tongans | 2.3 /100 | #240 | Tragic 48.3% |
| Native Hawaiians | 2.2 /100 | #241 | Tragic 48.3% |
Demographics Similar to Immigrants from Austria by Disability Age Over 75
In terms of disability age over 75, the demographic groups most similar to Immigrants from Austria are Paraguayan (45.0%, a difference of 0.080%), Okinawan (44.9%, a difference of 0.12%), Immigrants from Lithuania (44.9%, a difference of 0.16%), Bulgarian (45.1%, a difference of 0.24%), and Luxembourger (44.8%, a difference of 0.25%).
| Demographics | Rating | Rank | Disability Age Over 75 |
| Cypriots | 100.0 /100 | #1 | Exceptional 43.5% |
| Immigrants | Ireland | 100.0 /100 | #2 | Exceptional 44.7% |
| Eastern Europeans | 100.0 /100 | #3 | Exceptional 44.8% |
| Carpatho Rusyns | 100.0 /100 | #4 | Exceptional 44.8% |
| Luxembourgers | 100.0 /100 | #5 | Exceptional 44.8% |
| Immigrants | Lithuania | 100.0 /100 | #6 | Exceptional 44.9% |
| Okinawans | 100.0 /100 | #7 | Exceptional 44.9% |
| Immigrants | Austria | 100.0 /100 | #8 | Exceptional 44.9% |
| Paraguayans | 100.0 /100 | #9 | Exceptional 45.0% |
| Bulgarians | 100.0 /100 | #10 | Exceptional 45.1% |
| Lithuanians | 100.0 /100 | #11 | Exceptional 45.1% |
| Immigrants | Czechoslovakia | 100.0 /100 | #12 | Exceptional 45.1% |
| Latvians | 100.0 /100 | #13 | Exceptional 45.1% |
| Immigrants | Scotland | 100.0 /100 | #14 | Exceptional 45.1% |
| Immigrants | Sweden | 100.0 /100 | #15 | Exceptional 45.1% |