Subsaharan African vs Jordanian Disability Age Over 75

COMPARE

Subsaharan African
Race
Ancestry
AfghanAfricanAlaska NativeAlaskan AthabascanAlbanianAleutAlsatianAmericanApacheArabArapahoArgentineanArmenianAssyrian/Chaldean/SyriacAustralianAustrianBahamianBangladeshiBarbadianBasqueBelgianBelizeanBermudanBhutaneseBlackfeetBolivianBrazilianBritishBritish West IndianBulgarianBurmeseCajunCambodianCanadianCape VerdeanCarpatho RusynCelticCentral AmericanCentral American IndianCherokeeCheyenneChickasawChileanChineseChippewaChoctawColombianColvilleComancheCosta RicanCreeCreekCroatianCrowCubanCypriotCzechCzechoslovakianDanishDelawareDominicanDutchDutch West IndianEastern EuropeanEcuadorianEgyptianEnglishEstonianEthiopianEuropeanFijianFilipinoFinnishFrenchFrench American IndianFrench CanadianGermanGerman RussianGhanaianGreekGuamanian/ChamorroGuatemalanGuyaneseHaitianHmongHonduranHopiHoumaHungarianIcelanderIndian (Asian)IndonesianInupiatIranianIraqiIrishIroquoisIsraeliItalianJamaicanJapaneseKenyanKiowaKoreanLaotianLatvianLebaneseLiberianLithuanianLumbeeLuxembourgerMacedonianMalaysianMalteseMarshalleseMenomineeMexicanMexican American IndianMongolianMoroccanNative HawaiianNavajoNepaleseNew ZealanderNicaraguanNigerianNorthern EuropeanNorwegianOkinawanOsageOttawaPaiutePakistaniPalestinianPanamanianParaguayanPennsylvania GermanPeruvianPimaPolishPortuguesePotawatomiPuebloPuerto RicanPuget Sound SalishRomanianRussianSalvadoranSamoanScandinavianScotch-IrishScottishSeminoleSenegaleseSerbianShoshoneSierra LeoneanSiouxSlavicSlovakSloveneSomaliSouth AfricanSouth AmericanSouth American IndianSoviet UnionSpaniardSpanishSpanish AmericanSpanish American IndianSri LankanSubsaharan AfricanSudaneseSwedishSwissSyrianTaiwaneseThaiTlingit-HaidaTohono O'OdhamTonganTrinidadian and TobagonianTsimshianTurkishU.S. Virgin IslanderUgandanUkrainianUruguayanUteVenezuelanVietnameseWelshWest IndianYakamaYaquiYugoslavianYumanYup'ikZimbabwean
Immigration
NonimmigrantsImmigrantsAfghanistanAfricaAlbaniaArgentinaArmeniaAsiaAustraliaAustriaBahamasBangladeshBarbadosBelarusBelgiumBelizeBoliviaBosnia and HerzegovinaBrazilBulgariaBurma/MyanmarCabo VerdeCambodiaCameroonCanadaCaribbeanCentral AmericaChileChinaColombiaCongoCosta RicaCroatiaCubaCzechoslovakiaDenmarkDominicaDominican RepublicEastern AfricaEastern AsiaEastern EuropeEcuadorEgyptEl SalvadorEnglandEritreaEthiopiaEuropeFijiFranceGermanyGhanaGreeceGrenadaGuatemalaGuyanaHaitiHondurasHong KongHungaryIndiaIndonesiaIranIraqIrelandIsraelItalyJamaicaJapanJordanKazakhstanKenyaKoreaKuwaitLaosLatin AmericaLatviaLebanonLiberiaLithuaniaMalaysiaMexicoMicronesiaMiddle AfricaMoldovaMoroccoNepalNetherlandsNicaraguaNigeriaNorth AmericaNorth MacedoniaNorthern AfricaNorthern EuropeNorwayOceaniaPakistanPanamaPeruPhilippinesPolandPortugalRomaniaRussiaSaudi ArabiaScotlandSenegalSerbiaSierra LeoneSingaporeSomaliaSouth AfricaSouth AmericaSouth Central AsiaSouth Eastern AsiaSouthern EuropeSpainSri LankaSt. Vincent and the GrenadinesSudanSwedenSwitzerlandSyriaTaiwanThailandTrinidad and TobagoTurkeyUgandaUkraineUruguayUzbekistanVenezuelaVietnamWest IndiesWestern AfricaWestern AsiaWestern EuropeYemenZaireZimbabweAzores
Jordanian
Race
Ancestry
AfghanAfricanAlaska NativeAlaskan AthabascanAlbanianAleutAlsatianAmericanApacheArabArapahoArgentineanArmenianAssyrian/Chaldean/SyriacAustralianAustrianBahamianBangladeshiBarbadianBasqueBelgianBelizeanBermudanBhutaneseBlackfeetBolivianBrazilianBritishBritish West IndianBulgarianBurmeseCajunCambodianCanadianCape VerdeanCarpatho RusynCelticCentral AmericanCentral American IndianCherokeeCheyenneChickasawChileanChineseChippewaChoctawColombianColvilleComancheCosta RicanCreeCreekCroatianCrowCubanCypriotCzechCzechoslovakianDanishDelawareDominicanDutchDutch West IndianEastern EuropeanEcuadorianEgyptianEnglishEstonianEthiopianEuropeanFijianFilipinoFinnishFrenchFrench American IndianFrench CanadianGermanGerman RussianGhanaianGreekGuamanian/ChamorroGuatemalanGuyaneseHaitianHmongHonduranHopiHoumaHungarianIcelanderIndian (Asian)IndonesianInupiatIranianIraqiIrishIroquoisIsraeliItalianJamaicanJapaneseJordanianKenyanKiowaKoreanLaotianLatvianLebaneseLiberianLithuanianLumbeeLuxembourgerMacedonianMalaysianMalteseMarshalleseMenomineeMexicanMexican American IndianMongolianMoroccanNative HawaiianNavajoNepaleseNew ZealanderNicaraguanNigerianNorthern EuropeanNorwegianOkinawanOsageOttawaPaiutePakistaniPalestinianPanamanianParaguayanPennsylvania GermanPeruvianPimaPolishPortuguesePotawatomiPuebloPuerto RicanPuget Sound SalishRomanianRussianSalvadoranSamoanScandinavianScotch-IrishScottishSeminoleSenegaleseSerbianShoshoneSierra LeoneanSiouxSlavicSlovakSloveneSomaliSouth AfricanSouth AmericanSouth American IndianSoviet UnionSpaniardSpanishSpanish AmericanSpanish American IndianSri LankanSudaneseSwedishSwissSyrianTaiwaneseThaiTlingit-HaidaTohono O'OdhamTonganTrinidadian and TobagonianTsimshianTurkishU.S. Virgin IslanderUgandanUkrainianUruguayanUteVenezuelanVietnameseWelshWest IndianYakamaYaquiYugoslavianYumanYup'ikZimbabwean
Immigration
NonimmigrantsImmigrantsAfghanistanAfricaAlbaniaArgentinaArmeniaAsiaAustraliaAustriaBahamasBangladeshBarbadosBelarusBelgiumBelizeBoliviaBosnia and HerzegovinaBrazilBulgariaBurma/MyanmarCabo VerdeCambodiaCameroonCanadaCaribbeanCentral AmericaChileChinaColombiaCongoCosta RicaCroatiaCubaCzechoslovakiaDenmarkDominicaDominican RepublicEastern AfricaEastern AsiaEastern EuropeEcuadorEgyptEl SalvadorEnglandEritreaEthiopiaEuropeFijiFranceGermanyGhanaGreeceGrenadaGuatemalaGuyanaHaitiHondurasHong KongHungaryIndiaIndonesiaIranIraqIrelandIsraelItalyJamaicaJapanJordanKazakhstanKenyaKoreaKuwaitLaosLatin AmericaLatviaLebanonLiberiaLithuaniaMalaysiaMexicoMicronesiaMiddle AfricaMoldovaMoroccoNepalNetherlandsNicaraguaNigeriaNorth AmericaNorth MacedoniaNorthern AfricaNorthern EuropeNorwayOceaniaPakistanPanamaPeruPhilippinesPolandPortugalRomaniaRussiaSaudi ArabiaScotlandSenegalSerbiaSierra LeoneSingaporeSomaliaSouth AfricaSouth AmericaSouth Central AsiaSouth Eastern AsiaSouthern EuropeSpainSri LankaSt. Vincent and the GrenadinesSudanSwedenSwitzerlandSyriaTaiwanThailandTrinidad and TobagoTurkeyUgandaUkraineUruguayUzbekistanVenezuelaVietnamWest IndiesWestern AfricaWestern AsiaWestern EuropeYemenZaireZimbabweAzores
Disability Age Over 75
Income
Poverty
Unemployment
Labor Participation
Family Structure
Vehicle Availability
Education Level
Disability

Disability Age Over 75 Comparison

Sub-Saharan Africans

Jordanians

Tragic
Exceptional
48.2%
DISABILITY AGE OVER 75
3.8/ 100
METRIC RATING
234th/ 347
METRIC RANK
46.1%
DISABILITY AGE OVER 75
99.2/ 100
METRIC RATING
70th/ 347
METRIC RANK

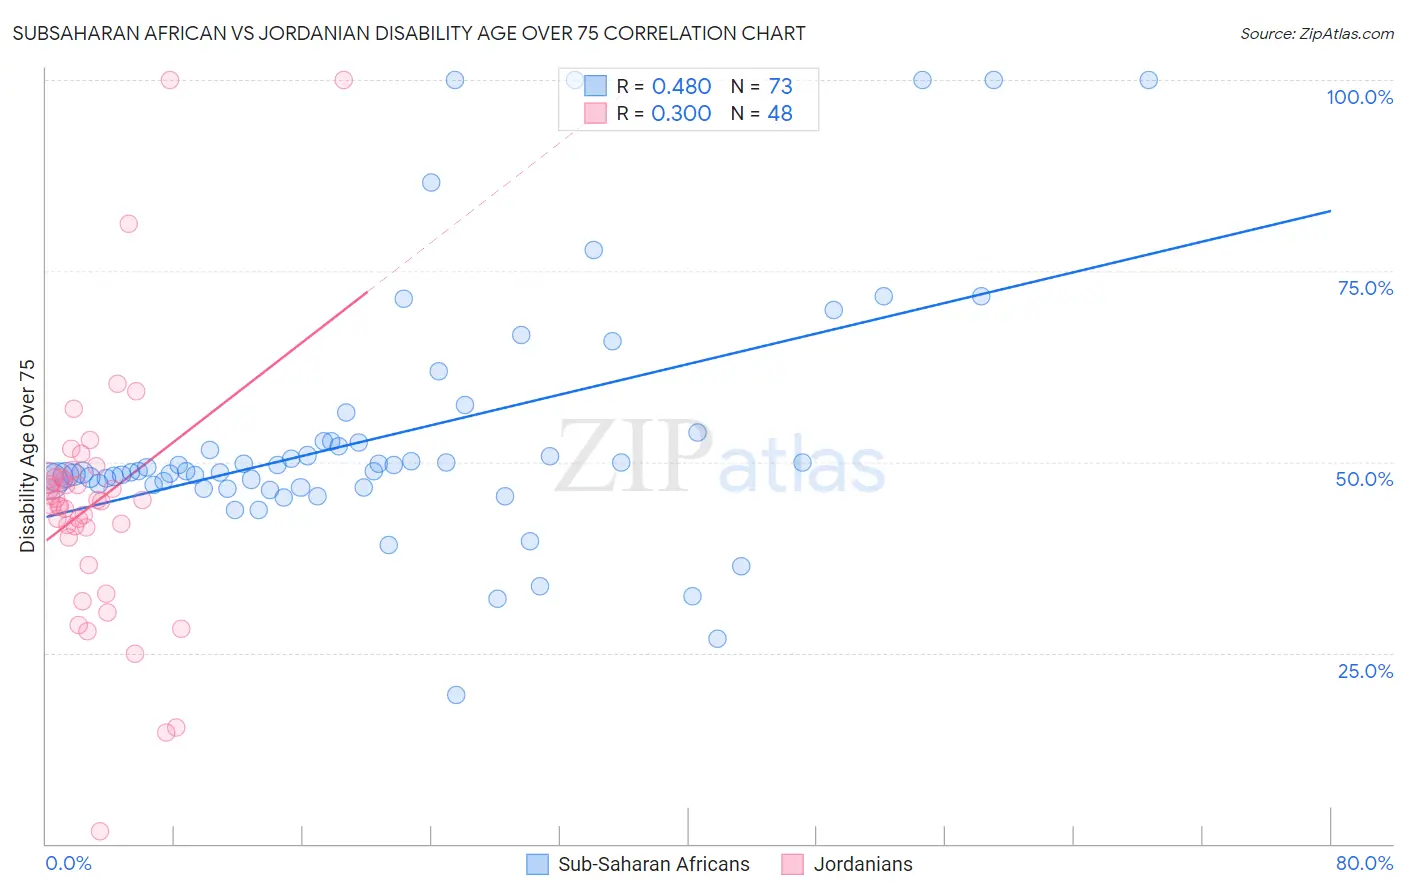
Subsaharan African vs Jordanian Disability Age Over 75 Correlation Chart

The statistical analysis conducted on geographies consisting of 506,598,024 people shows a moderate positive correlation between the proportion of Sub-Saharan Africans and percentage of population with a disability over the age of 75 in the United States with a correlation coefficient (R) of 0.480 and weighted average of 48.2%. Similarly, the statistical analysis conducted on geographies consisting of 166,361,859 people shows a mild positive correlation between the proportion of Jordanians and percentage of population with a disability over the age of 75 in the United States with a correlation coefficient (R) of 0.300 and weighted average of 46.1%, a difference of 4.6%.
Subsaharan African vs Jordanian Disability Age Over 75

Disability Age Over 75 Correlation Summary

MeasurementSubsaharan AfricanJordanian
Minimum19.4%1.6%
Maximum100.0%100.0%
Range80.6%98.4%
Mean53.4%44.7%
Median48.8%44.9%
Interquartile 25% (IQ1)46.9%40.8%
Interquartile 75% (IQ3)52.7%48.0%
Interquartile Range (IQR)5.8%7.2%
Standard Deviation (Sample)16.4%17.1%
Standard Deviation (Population)16.3%17.0%

Similar Demographics by Disability Age Over 75

Demographics Similar to Sub-Saharan Africans by Disability Age Over 75

In terms of disability age over 75, the demographic groups most similar to Sub-Saharan Africans are Hmong (48.2%, a difference of 0.0%), Indonesian (48.2%, a difference of 0.060%), Cree (48.2%, a difference of 0.060%), Immigrants (48.2%, a difference of 0.080%), and Taiwanese (48.2%, a difference of 0.090%).
DemographicsRating | RankDisability Age Over 75
Zimbabweans
6.4
/100
|
#227
Tragic
48.1%
Immigrants | Liberia
5.9
/100
|
#228
Tragic
48.1%
Spaniards
5.7
/100
|
#229
Tragic
48.1%
Taiwanese
4.4
/100
|
#230
Tragic
48.2%
Immigrants | Immigrants
4.3
/100
|
#231
Tragic
48.2%
Indonesians
4.2
/100
|
#232
Tragic
48.2%
Cree
4.2
/100
|
#233
Tragic
48.2%
Sub-Saharan Africans
3.8
/100
|
#234
Tragic
48.2%
Hmong
3.8
/100
|
#235
Tragic
48.2%
Immigrants | Nicaragua
3.2
/100
|
#236
Tragic
48.2%
Immigrants | St. Vincent and the Grenadines
3.2
/100
|
#237
Tragic
48.2%
Nicaraguans
3.0
/100
|
#238
Tragic
48.3%
Immigrants | Thailand
2.8
/100
|
#239
Tragic
48.3%
Tongans
2.3
/100
|
#240
Tragic
48.3%
Native Hawaiians
2.2
/100
|
#241
Tragic
48.3%

Demographics Similar to Jordanians by Disability Age Over 75

In terms of disability age over 75, the demographic groups most similar to Jordanians are Immigrants from Sri Lanka (46.1%, a difference of 0.030%), Immigrants from Hungary (46.1%, a difference of 0.070%), Cambodian (46.1%, a difference of 0.080%), Immigrants from Romania (46.0%, a difference of 0.10%), and Egyptian (46.1%, a difference of 0.13%).
DemographicsRating | RankDisability Age Over 75
Immigrants | Norway
99.5
/100
|
#63
Exceptional
45.9%
Immigrants | North Macedonia
99.5
/100
|
#64
Exceptional
45.9%
Austrians
99.5
/100
|
#65
Exceptional
46.0%
Immigrants | England
99.5
/100
|
#66
Exceptional
46.0%
Immigrants | Spain
99.4
/100
|
#67
Exceptional
46.0%
Immigrants | South Central Asia
99.4
/100
|
#68
Exceptional
46.0%
Immigrants | Romania
99.3
/100
|
#69
Exceptional
46.0%
Jordanians
99.2
/100
|
#70
Exceptional
46.1%
Immigrants | Sri Lanka
99.2
/100
|
#71
Exceptional
46.1%
Immigrants | Hungary
99.1
/100
|
#72
Exceptional
46.1%
Cambodians
99.1
/100
|
#73
Exceptional
46.1%
Egyptians
99.0
/100
|
#74
Exceptional
46.1%
Serbians
99.0
/100
|
#75
Exceptional
46.1%
Slavs
98.9
/100
|
#76
Exceptional
46.1%
Immigrants | Eastern Asia
98.9
/100
|
#77
Exceptional
46.2%