Subsaharan African vs Thai Disability Age Over 75
COMPARE
Subsaharan African
Thai
Disability Age Over 75
Disability Age Over 75 Comparison
Sub-Saharan Africans
Thais
48.2%
DISABILITY AGE OVER 75
3.8/ 100
METRIC RATING
234th/ 347
METRIC RANK
45.4%
DISABILITY AGE OVER 75
99.9/ 100
METRIC RATING
28th/ 347
METRIC RANK
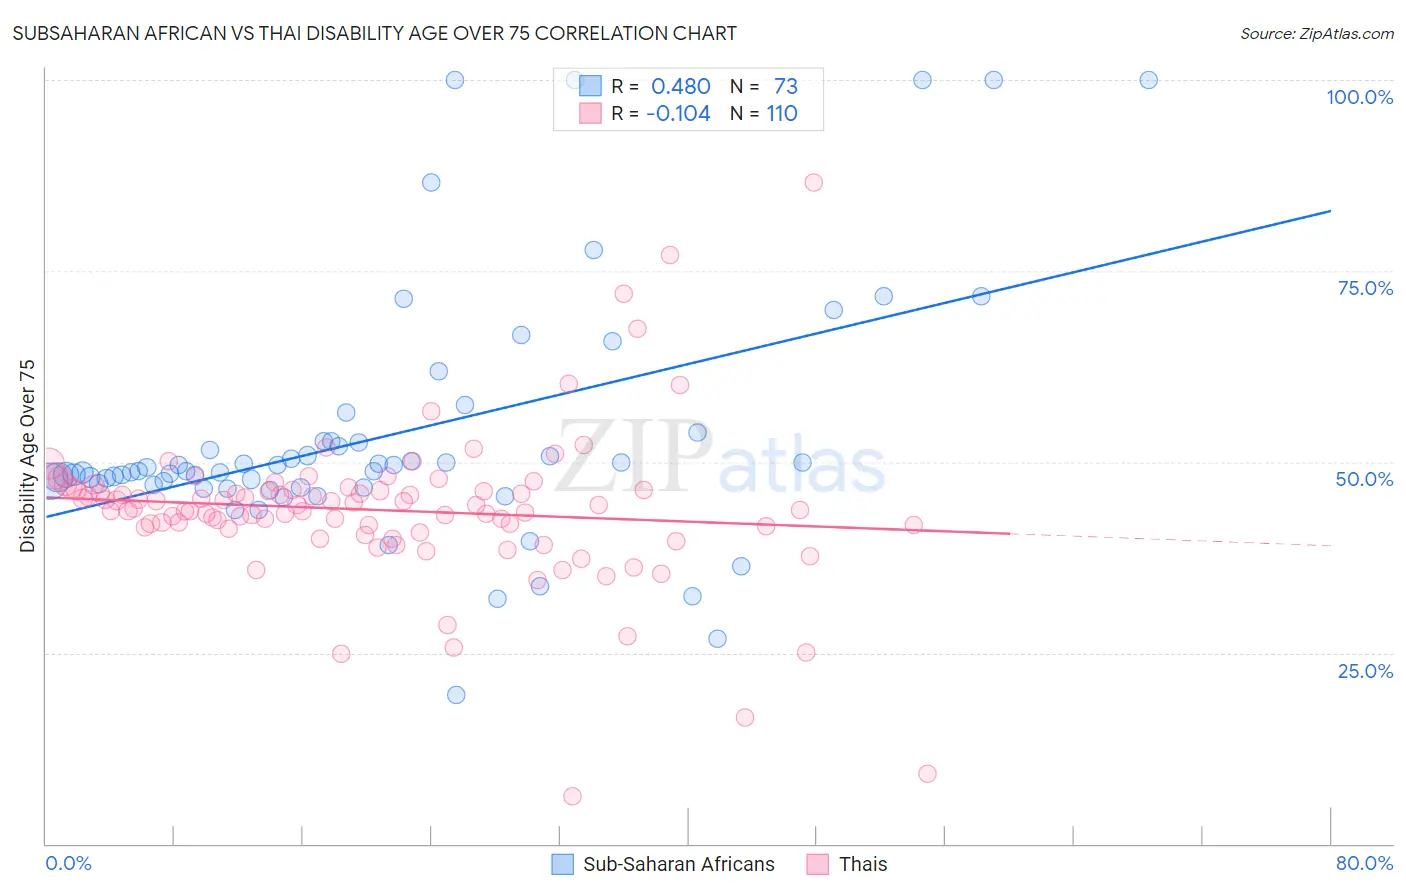
Subsaharan African vs Thai Disability Age Over 75 Correlation Chart
The statistical analysis conducted on geographies consisting of 506,598,024 people shows a moderate positive correlation between the proportion of Sub-Saharan Africans and percentage of population with a disability over the age of 75 in the United States with a correlation coefficient (R) of 0.480 and weighted average of 48.2%. Similarly, the statistical analysis conducted on geographies consisting of 474,673,142 people shows a poor negative correlation between the proportion of Thais and percentage of population with a disability over the age of 75 in the United States with a correlation coefficient (R) of -0.104 and weighted average of 45.4%, a difference of 6.2%.
Disability Age Over 75 Correlation Summary
| Measurement | Subsaharan African | Thai |
| Minimum | 19.4% | 6.2% |
| Maximum | 100.0% | 86.5% |
| Range | 80.6% | 80.3% |
| Mean | 53.4% | 43.7% |
| Median | 48.8% | 44.1% |
| Interquartile 25% (IQ1) | 46.9% | 41.4% |
| Interquartile 75% (IQ3) | 52.7% | 46.3% |
| Interquartile Range (IQR) | 5.8% | 4.8% |
| Standard Deviation (Sample) | 16.4% | 10.2% |
| Standard Deviation (Population) | 16.3% | 10.1% |
Similar Demographics by Disability Age Over 75
Demographics Similar to Sub-Saharan Africans by Disability Age Over 75
In terms of disability age over 75, the demographic groups most similar to Sub-Saharan Africans are Hmong (48.2%, a difference of 0.0%), Indonesian (48.2%, a difference of 0.060%), Cree (48.2%, a difference of 0.060%), Immigrants (48.2%, a difference of 0.080%), and Taiwanese (48.2%, a difference of 0.090%).
| Demographics | Rating | Rank | Disability Age Over 75 |
| Zimbabweans | 6.4 /100 | #227 | Tragic 48.1% |
| Immigrants | Liberia | 5.9 /100 | #228 | Tragic 48.1% |
| Spaniards | 5.7 /100 | #229 | Tragic 48.1% |
| Taiwanese | 4.4 /100 | #230 | Tragic 48.2% |
| Immigrants | Immigrants | 4.3 /100 | #231 | Tragic 48.2% |
| Indonesians | 4.2 /100 | #232 | Tragic 48.2% |
| Cree | 4.2 /100 | #233 | Tragic 48.2% |
| Sub-Saharan Africans | 3.8 /100 | #234 | Tragic 48.2% |
| Hmong | 3.8 /100 | #235 | Tragic 48.2% |
| Immigrants | Nicaragua | 3.2 /100 | #236 | Tragic 48.2% |
| Immigrants | St. Vincent and the Grenadines | 3.2 /100 | #237 | Tragic 48.2% |
| Nicaraguans | 3.0 /100 | #238 | Tragic 48.3% |
| Immigrants | Thailand | 2.8 /100 | #239 | Tragic 48.3% |
| Tongans | 2.3 /100 | #240 | Tragic 48.3% |
| Native Hawaiians | 2.2 /100 | #241 | Tragic 48.3% |
Demographics Similar to Thais by Disability Age Over 75
In terms of disability age over 75, the demographic groups most similar to Thais are Immigrants from Poland (45.4%, a difference of 0.020%), Macedonian (45.4%, a difference of 0.040%), Filipino (45.4%, a difference of 0.040%), Immigrants from Bolivia (45.4%, a difference of 0.070%), and Immigrants from Denmark (45.4%, a difference of 0.070%).
| Demographics | Rating | Rank | Disability Age Over 75 |
| Immigrants | Belgium | 100.0 /100 | #21 | Exceptional 45.3% |
| Immigrants | South Africa | 100.0 /100 | #22 | Exceptional 45.3% |
| Immigrants | Switzerland | 99.9 /100 | #23 | Exceptional 45.3% |
| Poles | 99.9 /100 | #24 | Exceptional 45.3% |
| Immigrants | Bolivia | 99.9 /100 | #25 | Exceptional 45.4% |
| Macedonians | 99.9 /100 | #26 | Exceptional 45.4% |
| Immigrants | Poland | 99.9 /100 | #27 | Exceptional 45.4% |
| Thais | 99.9 /100 | #28 | Exceptional 45.4% |
| Filipinos | 99.9 /100 | #29 | Exceptional 45.4% |
| Immigrants | Denmark | 99.9 /100 | #30 | Exceptional 45.4% |
| Immigrants | Bulgaria | 99.9 /100 | #31 | Exceptional 45.5% |
| Immigrants | Australia | 99.9 /100 | #32 | Exceptional 45.5% |
| Immigrants | Croatia | 99.9 /100 | #33 | Exceptional 45.5% |
| Russians | 99.9 /100 | #34 | Exceptional 45.5% |
| Norwegians | 99.9 /100 | #35 | Exceptional 45.5% |