Scotch-Irish vs Greek Disability Age 35 to 64
COMPARE
Scotch-Irish
Greek
Disability Age 35 to 64
Disability Age 35 to 64 Comparison
Scotch-Irish
Greeks
13.0%
DISABILITY AGE 35 TO 64
0.1/ 100
METRIC RATING
281st/ 347
METRIC RANK
10.7%
DISABILITY AGE 35 TO 64
92.3/ 100
METRIC RATING
135th/ 347
METRIC RANK
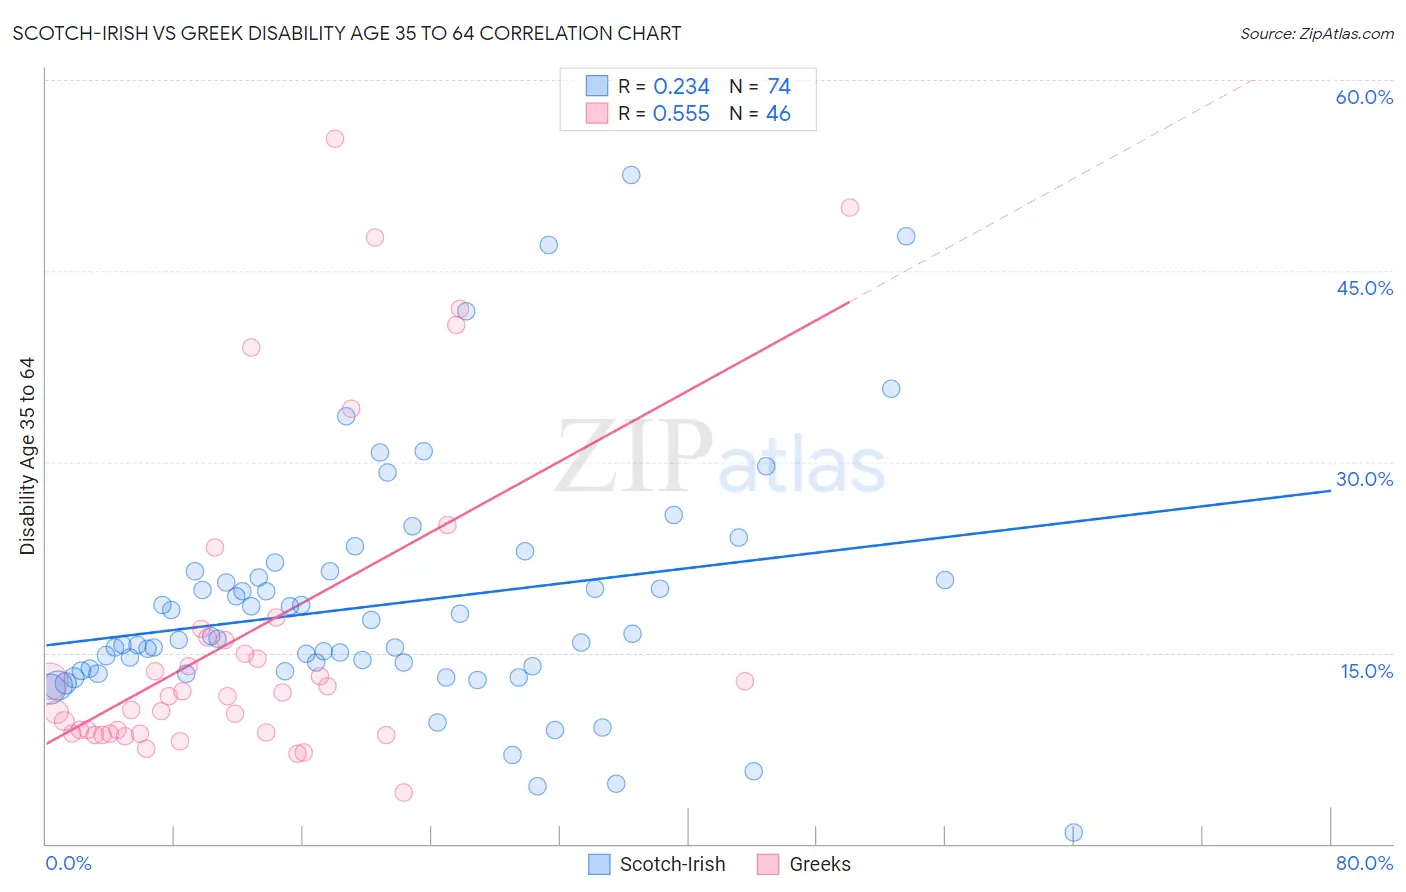
Scotch-Irish vs Greek Disability Age 35 to 64 Correlation Chart
The statistical analysis conducted on geographies consisting of 548,060,326 people shows a weak positive correlation between the proportion of Scotch-Irish and percentage of population with a disability between the ages 34 and 64 in the United States with a correlation coefficient (R) of 0.234 and weighted average of 13.0%. Similarly, the statistical analysis conducted on geographies consisting of 482,222,080 people shows a substantial positive correlation between the proportion of Greeks and percentage of population with a disability between the ages 34 and 64 in the United States with a correlation coefficient (R) of 0.555 and weighted average of 10.7%, a difference of 21.1%.
Disability Age 35 to 64 Correlation Summary
| Measurement | Scotch-Irish | Greek |
| Minimum | 0.87% | 4.0% |
| Maximum | 52.5% | 55.4% |
| Range | 51.7% | 51.4% |
| Mean | 18.7% | 16.5% |
| Median | 16.1% | 11.8% |
| Interquartile 25% (IQ1) | 13.6% | 8.7% |
| Interquartile 75% (IQ3) | 20.9% | 16.2% |
| Interquartile Range (IQR) | 7.3% | 7.5% |
| Standard Deviation (Sample) | 9.4% | 12.7% |
| Standard Deviation (Population) | 9.4% | 12.6% |
Similar Demographics by Disability Age 35 to 64
Demographics Similar to Scotch-Irish by Disability Age 35 to 64
In terms of disability age 35 to 64, the demographic groups most similar to Scotch-Irish are Immigrants from Laos (13.0%, a difference of 0.090%), Liberian (12.9%, a difference of 0.20%), Immigrants from Micronesia (12.9%, a difference of 0.36%), French Canadian (12.9%, a difference of 0.39%), and Immigrants from Dominican Republic (12.9%, a difference of 0.42%).
| Demographics | Rating | Rank | Disability Age 35 to 64 |
| Celtics | 0.1 /100 | #274 | Tragic 12.9% |
| Dominicans | 0.1 /100 | #275 | Tragic 12.9% |
| Somalis | 0.1 /100 | #276 | Tragic 12.9% |
| Immigrants | Dominican Republic | 0.1 /100 | #277 | Tragic 12.9% |
| French Canadians | 0.1 /100 | #278 | Tragic 12.9% |
| Immigrants | Micronesia | 0.1 /100 | #279 | Tragic 12.9% |
| Liberians | 0.1 /100 | #280 | Tragic 12.9% |
| Scotch-Irish | 0.1 /100 | #281 | Tragic 13.0% |
| Immigrants | Laos | 0.1 /100 | #282 | Tragic 13.0% |
| Central American Indians | 0.0 /100 | #283 | Tragic 13.0% |
| Immigrants | Nonimmigrants | 0.0 /100 | #284 | Tragic 13.0% |
| Immigrants | Somalia | 0.0 /100 | #285 | Tragic 13.1% |
| Hmong | 0.0 /100 | #286 | Tragic 13.1% |
| Tlingit-Haida | 0.0 /100 | #287 | Tragic 13.2% |
| Fijians | 0.0 /100 | #288 | Tragic 13.2% |
Demographics Similar to Greeks by Disability Age 35 to 64
In terms of disability age 35 to 64, the demographic groups most similar to Greeks are Immigrants from Albania (10.7%, a difference of 0.050%), Immigrants (10.7%, a difference of 0.050%), Immigrants from Ecuador (10.7%, a difference of 0.050%), Salvadoran (10.7%, a difference of 0.11%), and Immigrants from El Salvador (10.7%, a difference of 0.16%).
| Demographics | Rating | Rank | Disability Age 35 to 64 |
| South Africans | 93.3 /100 | #128 | Exceptional 10.7% |
| Ecuadorians | 93.1 /100 | #129 | Exceptional 10.7% |
| Immigrants | Syria | 93.0 /100 | #130 | Exceptional 10.7% |
| Immigrants | El Salvador | 92.8 /100 | #131 | Exceptional 10.7% |
| Immigrants | Albania | 92.5 /100 | #132 | Exceptional 10.7% |
| Immigrants | Immigrants | 92.5 /100 | #133 | Exceptional 10.7% |
| Immigrants | Ecuador | 92.5 /100 | #134 | Exceptional 10.7% |
| Greeks | 92.3 /100 | #135 | Exceptional 10.7% |
| Salvadorans | 91.9 /100 | #136 | Exceptional 10.7% |
| Immigrants | Costa Rica | 91.7 /100 | #137 | Exceptional 10.7% |
| Immigrants | Southern Europe | 91.5 /100 | #138 | Exceptional 10.7% |
| Costa Ricans | 91.4 /100 | #139 | Exceptional 10.7% |
| Immigrants | Scotland | 91.3 /100 | #140 | Exceptional 10.7% |
| Australians | 90.7 /100 | #141 | Exceptional 10.8% |
| Immigrants | Saudi Arabia | 90.6 /100 | #142 | Exceptional 10.8% |