Scotch-Irish vs Laotian Disability Age 35 to 64
COMPARE
Scotch-Irish
Laotian
Disability Age 35 to 64
Disability Age 35 to 64 Comparison
Scotch-Irish
Laotians
13.0%
DISABILITY AGE 35 TO 64
0.1/ 100
METRIC RATING
281st/ 347
METRIC RANK
10.1%
DISABILITY AGE 35 TO 64
99.4/ 100
METRIC RATING
74th/ 347
METRIC RANK
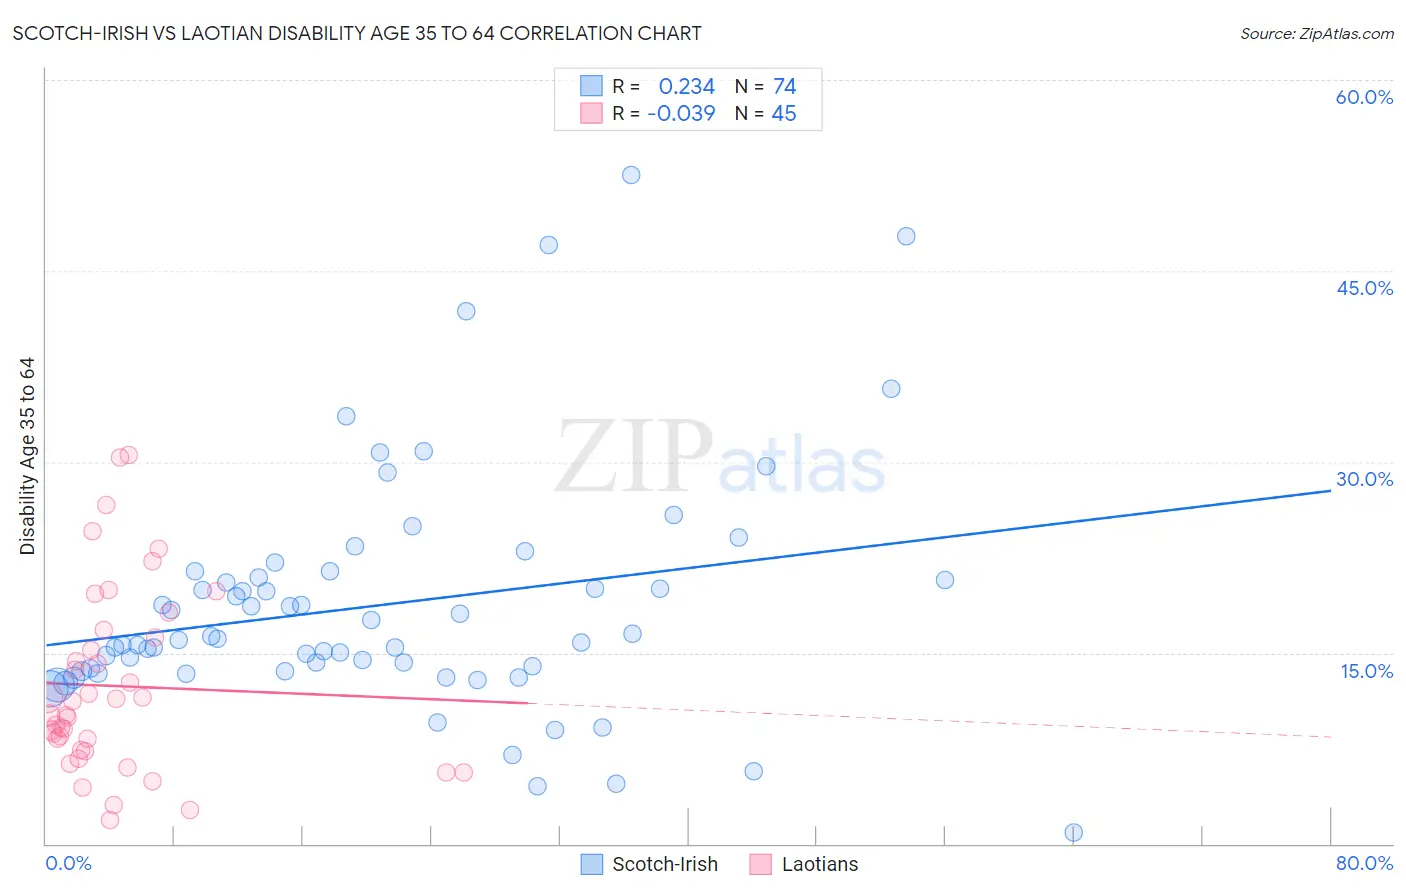
Scotch-Irish vs Laotian Disability Age 35 to 64 Correlation Chart
The statistical analysis conducted on geographies consisting of 548,060,326 people shows a weak positive correlation between the proportion of Scotch-Irish and percentage of population with a disability between the ages 34 and 64 in the United States with a correlation coefficient (R) of 0.234 and weighted average of 13.0%. Similarly, the statistical analysis conducted on geographies consisting of 224,740,086 people shows no correlation between the proportion of Laotians and percentage of population with a disability between the ages 34 and 64 in the United States with a correlation coefficient (R) of -0.039 and weighted average of 10.1%, a difference of 28.2%.
Disability Age 35 to 64 Correlation Summary
| Measurement | Scotch-Irish | Laotian |
| Minimum | 0.87% | 1.9% |
| Maximum | 52.5% | 30.5% |
| Range | 51.7% | 28.6% |
| Mean | 18.7% | 12.4% |
| Median | 16.1% | 10.2% |
| Interquartile 25% (IQ1) | 13.6% | 7.3% |
| Interquartile 75% (IQ3) | 20.9% | 16.5% |
| Interquartile Range (IQR) | 7.3% | 9.1% |
| Standard Deviation (Sample) | 9.4% | 7.2% |
| Standard Deviation (Population) | 9.4% | 7.1% |
Similar Demographics by Disability Age 35 to 64
Demographics Similar to Scotch-Irish by Disability Age 35 to 64
In terms of disability age 35 to 64, the demographic groups most similar to Scotch-Irish are Immigrants from Laos (13.0%, a difference of 0.090%), Liberian (12.9%, a difference of 0.20%), Immigrants from Micronesia (12.9%, a difference of 0.36%), French Canadian (12.9%, a difference of 0.39%), and Immigrants from Dominican Republic (12.9%, a difference of 0.42%).
| Demographics | Rating | Rank | Disability Age 35 to 64 |
| Celtics | 0.1 /100 | #274 | Tragic 12.9% |
| Dominicans | 0.1 /100 | #275 | Tragic 12.9% |
| Somalis | 0.1 /100 | #276 | Tragic 12.9% |
| Immigrants | Dominican Republic | 0.1 /100 | #277 | Tragic 12.9% |
| French Canadians | 0.1 /100 | #278 | Tragic 12.9% |
| Immigrants | Micronesia | 0.1 /100 | #279 | Tragic 12.9% |
| Liberians | 0.1 /100 | #280 | Tragic 12.9% |
| Scotch-Irish | 0.1 /100 | #281 | Tragic 13.0% |
| Immigrants | Laos | 0.1 /100 | #282 | Tragic 13.0% |
| Central American Indians | 0.0 /100 | #283 | Tragic 13.0% |
| Immigrants | Nonimmigrants | 0.0 /100 | #284 | Tragic 13.0% |
| Immigrants | Somalia | 0.0 /100 | #285 | Tragic 13.1% |
| Hmong | 0.0 /100 | #286 | Tragic 13.1% |
| Tlingit-Haida | 0.0 /100 | #287 | Tragic 13.2% |
| Fijians | 0.0 /100 | #288 | Tragic 13.2% |
Demographics Similar to Laotians by Disability Age 35 to 64
In terms of disability age 35 to 64, the demographic groups most similar to Laotians are Immigrants from Latvia (10.1%, a difference of 0.090%), Immigrants from Chile (10.1%, a difference of 0.10%), Mongolian (10.1%, a difference of 0.14%), Immigrants from France (10.1%, a difference of 0.18%), and Immigrants from Northern Europe (10.1%, a difference of 0.19%).
| Demographics | Rating | Rank | Disability Age 35 to 64 |
| Immigrants | Uzbekistan | 99.5 /100 | #67 | Exceptional 10.1% |
| Immigrants | Switzerland | 99.5 /100 | #68 | Exceptional 10.1% |
| Immigrants | Eastern Europe | 99.5 /100 | #69 | Exceptional 10.1% |
| Immigrants | Nicaragua | 99.5 /100 | #70 | Exceptional 10.1% |
| Immigrants | Kazakhstan | 99.5 /100 | #71 | Exceptional 10.1% |
| Immigrants | Northern Europe | 99.5 /100 | #72 | Exceptional 10.1% |
| Immigrants | France | 99.5 /100 | #73 | Exceptional 10.1% |
| Laotians | 99.4 /100 | #74 | Exceptional 10.1% |
| Immigrants | Latvia | 99.4 /100 | #75 | Exceptional 10.1% |
| Immigrants | Chile | 99.4 /100 | #76 | Exceptional 10.1% |
| Mongolians | 99.4 /100 | #77 | Exceptional 10.1% |
| Jordanians | 99.3 /100 | #78 | Exceptional 10.1% |
| Immigrants | Vietnam | 99.3 /100 | #79 | Exceptional 10.1% |
| Immigrants | Croatia | 99.3 /100 | #80 | Exceptional 10.2% |
| Latvians | 99.2 /100 | #81 | Exceptional 10.2% |