Scotch-Irish vs Sudanese Disability Age 35 to 64
COMPARE
Scotch-Irish
Sudanese
Disability Age 35 to 64
Disability Age 35 to 64 Comparison
Scotch-Irish
Sudanese
13.0%
DISABILITY AGE 35 TO 64
0.1/ 100
METRIC RATING
281st/ 347
METRIC RANK
11.9%
DISABILITY AGE 35 TO 64
5.3/ 100
METRIC RATING
232nd/ 347
METRIC RANK
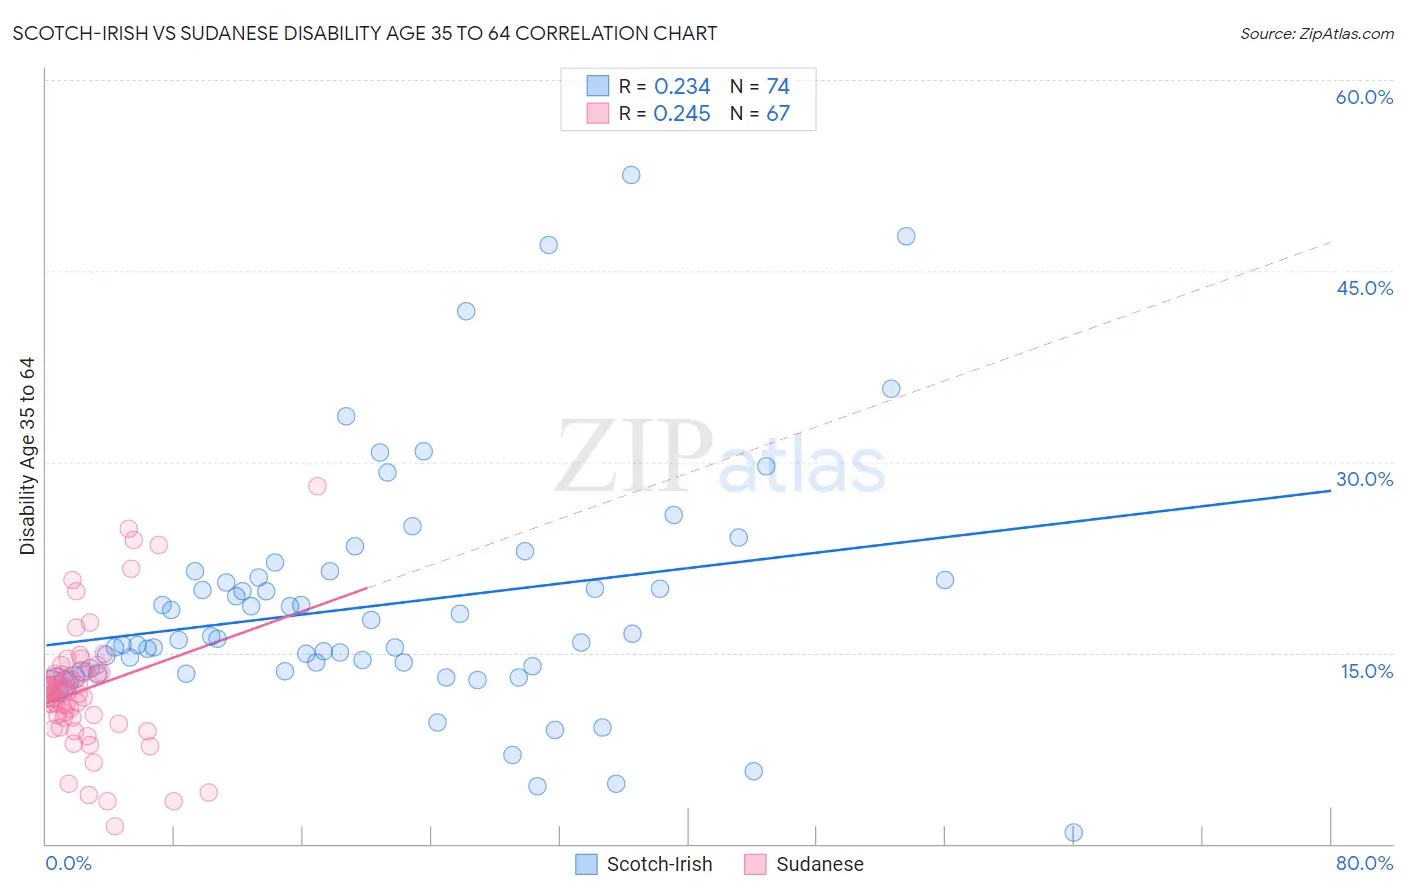
Scotch-Irish vs Sudanese Disability Age 35 to 64 Correlation Chart
The statistical analysis conducted on geographies consisting of 548,060,326 people shows a weak positive correlation between the proportion of Scotch-Irish and percentage of population with a disability between the ages 34 and 64 in the United States with a correlation coefficient (R) of 0.234 and weighted average of 13.0%. Similarly, the statistical analysis conducted on geographies consisting of 110,102,872 people shows a weak positive correlation between the proportion of Sudanese and percentage of population with a disability between the ages 34 and 64 in the United States with a correlation coefficient (R) of 0.245 and weighted average of 11.9%, a difference of 8.7%.
Disability Age 35 to 64 Correlation Summary
| Measurement | Scotch-Irish | Sudanese |
| Minimum | 0.87% | 1.4% |
| Maximum | 52.5% | 28.1% |
| Range | 51.7% | 26.7% |
| Mean | 18.7% | 12.2% |
| Median | 16.1% | 11.9% |
| Interquartile 25% (IQ1) | 13.6% | 9.9% |
| Interquartile 75% (IQ3) | 20.9% | 13.4% |
| Interquartile Range (IQR) | 7.3% | 3.5% |
| Standard Deviation (Sample) | 9.4% | 5.0% |
| Standard Deviation (Population) | 9.4% | 5.0% |
Similar Demographics by Disability Age 35 to 64
Demographics Similar to Scotch-Irish by Disability Age 35 to 64
In terms of disability age 35 to 64, the demographic groups most similar to Scotch-Irish are Immigrants from Laos (13.0%, a difference of 0.090%), Liberian (12.9%, a difference of 0.20%), Immigrants from Micronesia (12.9%, a difference of 0.36%), French Canadian (12.9%, a difference of 0.39%), and Immigrants from Dominican Republic (12.9%, a difference of 0.42%).
| Demographics | Rating | Rank | Disability Age 35 to 64 |
| Celtics | 0.1 /100 | #274 | Tragic 12.9% |
| Dominicans | 0.1 /100 | #275 | Tragic 12.9% |
| Somalis | 0.1 /100 | #276 | Tragic 12.9% |
| Immigrants | Dominican Republic | 0.1 /100 | #277 | Tragic 12.9% |
| French Canadians | 0.1 /100 | #278 | Tragic 12.9% |
| Immigrants | Micronesia | 0.1 /100 | #279 | Tragic 12.9% |
| Liberians | 0.1 /100 | #280 | Tragic 12.9% |
| Scotch-Irish | 0.1 /100 | #281 | Tragic 13.0% |
| Immigrants | Laos | 0.1 /100 | #282 | Tragic 13.0% |
| Central American Indians | 0.0 /100 | #283 | Tragic 13.0% |
| Immigrants | Nonimmigrants | 0.0 /100 | #284 | Tragic 13.0% |
| Immigrants | Somalia | 0.0 /100 | #285 | Tragic 13.1% |
| Hmong | 0.0 /100 | #286 | Tragic 13.1% |
| Tlingit-Haida | 0.0 /100 | #287 | Tragic 13.2% |
| Fijians | 0.0 /100 | #288 | Tragic 13.2% |
Demographics Similar to Sudanese by Disability Age 35 to 64
In terms of disability age 35 to 64, the demographic groups most similar to Sudanese are Bermudan (11.9%, a difference of 0.11%), Jamaican (11.9%, a difference of 0.14%), Panamanian (11.9%, a difference of 0.17%), Portuguese (11.9%, a difference of 0.18%), and British West Indian (11.9%, a difference of 0.27%).
| Demographics | Rating | Rank | Disability Age 35 to 64 |
| Immigrants | Belize | 6.6 /100 | #225 | Tragic 11.9% |
| Scandinavians | 6.4 /100 | #226 | Tragic 11.9% |
| Immigrants | Central America | 6.3 /100 | #227 | Tragic 11.9% |
| Immigrants | Germany | 6.2 /100 | #228 | Tragic 11.9% |
| British West Indians | 6.1 /100 | #229 | Tragic 11.9% |
| Panamanians | 5.8 /100 | #230 | Tragic 11.9% |
| Jamaicans | 5.7 /100 | #231 | Tragic 11.9% |
| Sudanese | 5.3 /100 | #232 | Tragic 11.9% |
| Bermudans | 5.0 /100 | #233 | Tragic 11.9% |
| Portuguese | 4.9 /100 | #234 | Tragic 11.9% |
| Belizeans | 4.5 /100 | #235 | Tragic 12.0% |
| Immigrants | Middle Africa | 4.5 /100 | #236 | Tragic 12.0% |
| Immigrants | Cambodia | 3.9 /100 | #237 | Tragic 12.0% |
| West Indians | 3.7 /100 | #238 | Tragic 12.0% |
| Immigrants | Western Africa | 3.3 /100 | #239 | Tragic 12.0% |