Scotch-Irish vs Haitian Disability Age 35 to 64
COMPARE
Scotch-Irish
Haitian
Disability Age 35 to 64
Disability Age 35 to 64 Comparison
Scotch-Irish
Haitians
13.0%
DISABILITY AGE 35 TO 64
0.1/ 100
METRIC RATING
281st/ 347
METRIC RANK
11.2%
DISABILITY AGE 35 TO 64
59.0/ 100
METRIC RATING
169th/ 347
METRIC RANK
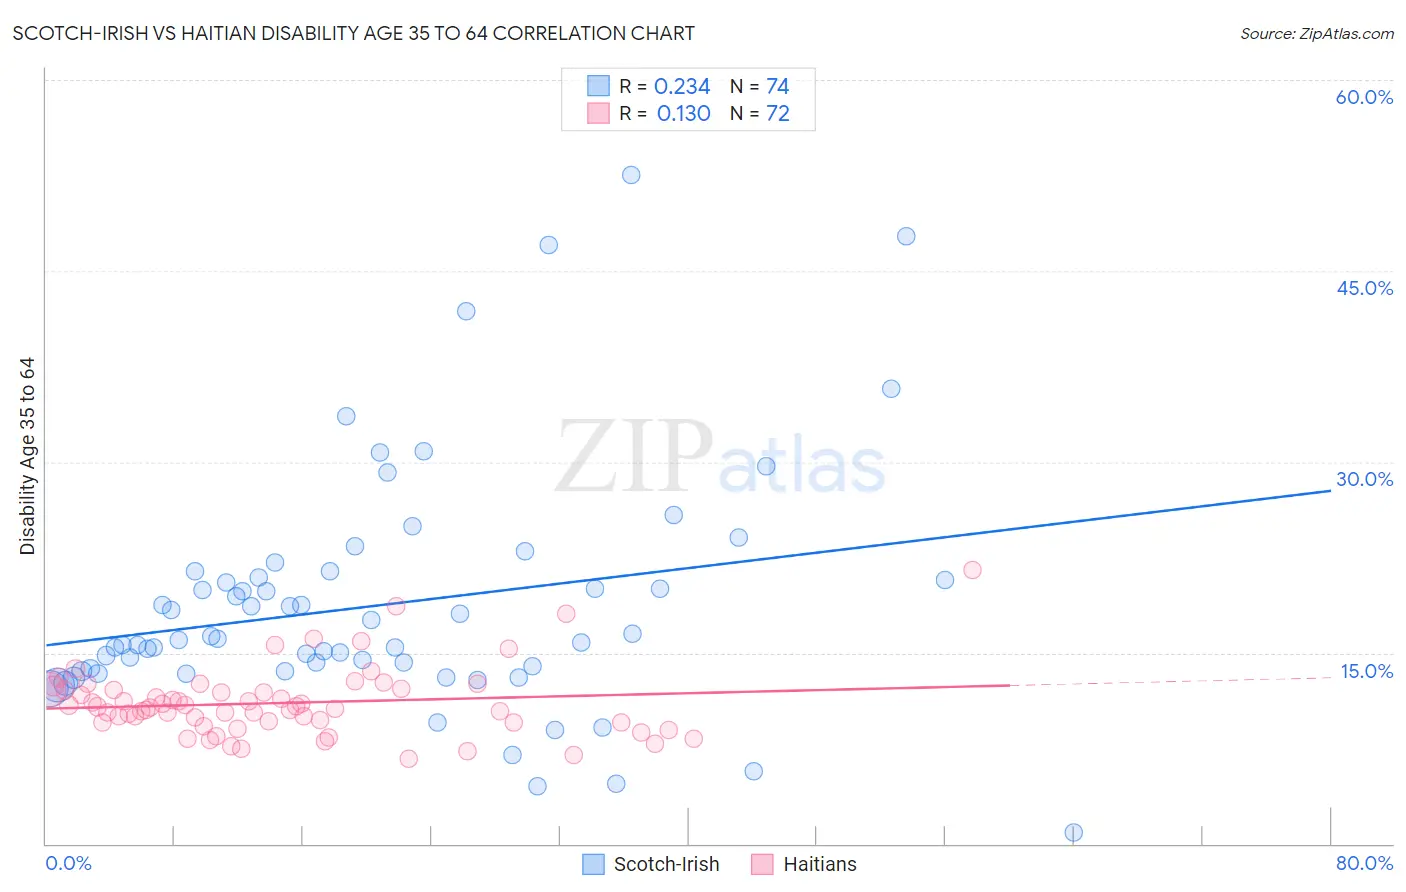
Scotch-Irish vs Haitian Disability Age 35 to 64 Correlation Chart
The statistical analysis conducted on geographies consisting of 548,060,326 people shows a weak positive correlation between the proportion of Scotch-Irish and percentage of population with a disability between the ages 34 and 64 in the United States with a correlation coefficient (R) of 0.234 and weighted average of 13.0%. Similarly, the statistical analysis conducted on geographies consisting of 287,610,398 people shows a poor positive correlation between the proportion of Haitians and percentage of population with a disability between the ages 34 and 64 in the United States with a correlation coefficient (R) of 0.130 and weighted average of 11.2%, a difference of 15.9%.
Disability Age 35 to 64 Correlation Summary
| Measurement | Scotch-Irish | Haitian |
| Minimum | 0.87% | 6.7% |
| Maximum | 52.5% | 21.5% |
| Range | 51.7% | 14.9% |
| Mean | 18.7% | 11.1% |
| Median | 16.1% | 10.7% |
| Interquartile 25% (IQ1) | 13.6% | 9.5% |
| Interquartile 75% (IQ3) | 20.9% | 12.1% |
| Interquartile Range (IQR) | 7.3% | 2.6% |
| Standard Deviation (Sample) | 9.4% | 2.7% |
| Standard Deviation (Population) | 9.4% | 2.7% |
Similar Demographics by Disability Age 35 to 64
Demographics Similar to Scotch-Irish by Disability Age 35 to 64
In terms of disability age 35 to 64, the demographic groups most similar to Scotch-Irish are Immigrants from Laos (13.0%, a difference of 0.090%), Liberian (12.9%, a difference of 0.20%), Immigrants from Micronesia (12.9%, a difference of 0.36%), French Canadian (12.9%, a difference of 0.39%), and Immigrants from Dominican Republic (12.9%, a difference of 0.42%).
| Demographics | Rating | Rank | Disability Age 35 to 64 |
| Celtics | 0.1 /100 | #274 | Tragic 12.9% |
| Dominicans | 0.1 /100 | #275 | Tragic 12.9% |
| Somalis | 0.1 /100 | #276 | Tragic 12.9% |
| Immigrants | Dominican Republic | 0.1 /100 | #277 | Tragic 12.9% |
| French Canadians | 0.1 /100 | #278 | Tragic 12.9% |
| Immigrants | Micronesia | 0.1 /100 | #279 | Tragic 12.9% |
| Liberians | 0.1 /100 | #280 | Tragic 12.9% |
| Scotch-Irish | 0.1 /100 | #281 | Tragic 13.0% |
| Immigrants | Laos | 0.1 /100 | #282 | Tragic 13.0% |
| Central American Indians | 0.0 /100 | #283 | Tragic 13.0% |
| Immigrants | Nonimmigrants | 0.0 /100 | #284 | Tragic 13.0% |
| Immigrants | Somalia | 0.0 /100 | #285 | Tragic 13.1% |
| Hmong | 0.0 /100 | #286 | Tragic 13.1% |
| Tlingit-Haida | 0.0 /100 | #287 | Tragic 13.2% |
| Fijians | 0.0 /100 | #288 | Tragic 13.2% |
Demographics Similar to Haitians by Disability Age 35 to 64
In terms of disability age 35 to 64, the demographic groups most similar to Haitians are Central American (11.2%, a difference of 0.010%), Immigrants from Uganda (11.2%, a difference of 0.080%), Immigrants from Trinidad and Tobago (11.2%, a difference of 0.25%), Italian (11.2%, a difference of 0.27%), and Austrian (11.1%, a difference of 0.36%).
| Demographics | Rating | Rank | Disability Age 35 to 64 |
| Immigrants | Grenada | 68.4 /100 | #162 | Good 11.1% |
| Immigrants | St. Vincent and the Grenadines | 66.6 /100 | #163 | Good 11.1% |
| Pakistanis | 65.8 /100 | #164 | Good 11.1% |
| Immigrants | Western Europe | 65.2 /100 | #165 | Good 11.1% |
| Immigrants | Haiti | 63.8 /100 | #166 | Good 11.1% |
| Austrians | 63.2 /100 | #167 | Good 11.1% |
| Central Americans | 59.1 /100 | #168 | Average 11.2% |
| Haitians | 59.0 /100 | #169 | Average 11.2% |
| Immigrants | Uganda | 58.0 /100 | #170 | Average 11.2% |
| Immigrants | Trinidad and Tobago | 55.9 /100 | #171 | Average 11.2% |
| Italians | 55.6 /100 | #172 | Average 11.2% |
| Lebanese | 51.8 /100 | #173 | Average 11.3% |
| Immigrants | Fiji | 50.0 /100 | #174 | Average 11.3% |
| Czechs | 47.9 /100 | #175 | Average 11.3% |
| Ugandans | 43.7 /100 | #176 | Average 11.3% |