Scotch-Irish vs Yugoslavian Disability Age 35 to 64
COMPARE
Scotch-Irish
Yugoslavian
Disability Age 35 to 64
Disability Age 35 to 64 Comparison
Scotch-Irish
Yugoslavians
13.0%
DISABILITY AGE 35 TO 64
0.1/ 100
METRIC RATING
281st/ 347
METRIC RANK
11.7%
DISABILITY AGE 35 TO 64
11.6/ 100
METRIC RATING
213th/ 347
METRIC RANK
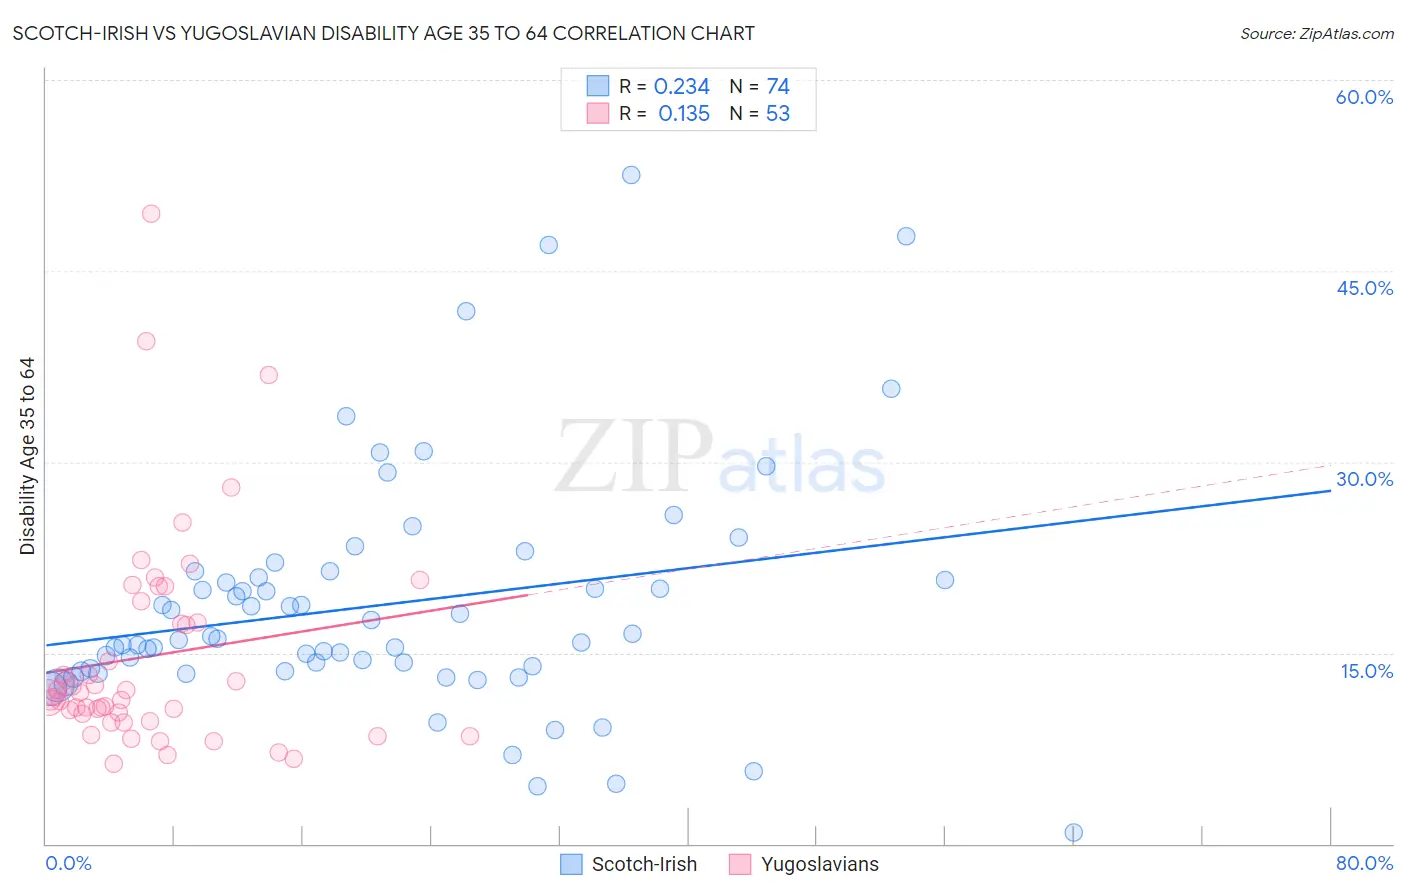
Scotch-Irish vs Yugoslavian Disability Age 35 to 64 Correlation Chart
The statistical analysis conducted on geographies consisting of 548,060,326 people shows a weak positive correlation between the proportion of Scotch-Irish and percentage of population with a disability between the ages 34 and 64 in the United States with a correlation coefficient (R) of 0.234 and weighted average of 13.0%. Similarly, the statistical analysis conducted on geographies consisting of 285,604,714 people shows a poor positive correlation between the proportion of Yugoslavians and percentage of population with a disability between the ages 34 and 64 in the United States with a correlation coefficient (R) of 0.135 and weighted average of 11.7%, a difference of 10.5%.
Disability Age 35 to 64 Correlation Summary
| Measurement | Scotch-Irish | Yugoslavian |
| Minimum | 0.87% | 6.2% |
| Maximum | 52.5% | 49.5% |
| Range | 51.7% | 43.3% |
| Mean | 18.7% | 14.7% |
| Median | 16.1% | 11.5% |
| Interquartile 25% (IQ1) | 13.6% | 9.9% |
| Interquartile 75% (IQ3) | 20.9% | 18.2% |
| Interquartile Range (IQR) | 7.3% | 8.3% |
| Standard Deviation (Sample) | 9.4% | 8.5% |
| Standard Deviation (Population) | 9.4% | 8.4% |
Similar Demographics by Disability Age 35 to 64
Demographics Similar to Scotch-Irish by Disability Age 35 to 64
In terms of disability age 35 to 64, the demographic groups most similar to Scotch-Irish are Immigrants from Laos (13.0%, a difference of 0.090%), Liberian (12.9%, a difference of 0.20%), Immigrants from Micronesia (12.9%, a difference of 0.36%), French Canadian (12.9%, a difference of 0.39%), and Immigrants from Dominican Republic (12.9%, a difference of 0.42%).
| Demographics | Rating | Rank | Disability Age 35 to 64 |
| Celtics | 0.1 /100 | #274 | Tragic 12.9% |
| Dominicans | 0.1 /100 | #275 | Tragic 12.9% |
| Somalis | 0.1 /100 | #276 | Tragic 12.9% |
| Immigrants | Dominican Republic | 0.1 /100 | #277 | Tragic 12.9% |
| French Canadians | 0.1 /100 | #278 | Tragic 12.9% |
| Immigrants | Micronesia | 0.1 /100 | #279 | Tragic 12.9% |
| Liberians | 0.1 /100 | #280 | Tragic 12.9% |
| Scotch-Irish | 0.1 /100 | #281 | Tragic 13.0% |
| Immigrants | Laos | 0.1 /100 | #282 | Tragic 13.0% |
| Central American Indians | 0.0 /100 | #283 | Tragic 13.0% |
| Immigrants | Nonimmigrants | 0.0 /100 | #284 | Tragic 13.0% |
| Immigrants | Somalia | 0.0 /100 | #285 | Tragic 13.1% |
| Hmong | 0.0 /100 | #286 | Tragic 13.1% |
| Tlingit-Haida | 0.0 /100 | #287 | Tragic 13.2% |
| Fijians | 0.0 /100 | #288 | Tragic 13.2% |
Demographics Similar to Yugoslavians by Disability Age 35 to 64
In terms of disability age 35 to 64, the demographic groups most similar to Yugoslavians are Immigrants from Jamaica (11.7%, a difference of 0.030%), Immigrants from Sudan (11.7%, a difference of 0.030%), Spanish American Indian (11.7%, a difference of 0.090%), Bahamian (11.8%, a difference of 0.18%), and Canadian (11.7%, a difference of 0.25%).
| Demographics | Rating | Rank | Disability Age 35 to 64 |
| Native Hawaiians | 14.8 /100 | #206 | Poor 11.7% |
| Ghanaians | 14.8 /100 | #207 | Poor 11.7% |
| Guatemalans | 14.6 /100 | #208 | Poor 11.7% |
| Europeans | 13.5 /100 | #209 | Poor 11.7% |
| Belgians | 13.1 /100 | #210 | Poor 11.7% |
| Canadians | 13.0 /100 | #211 | Poor 11.7% |
| Immigrants | Jamaica | 11.8 /100 | #212 | Poor 11.7% |
| Yugoslavians | 11.6 /100 | #213 | Poor 11.7% |
| Immigrants | Sudan | 11.4 /100 | #214 | Poor 11.7% |
| Spanish American Indians | 11.1 /100 | #215 | Poor 11.7% |
| Bahamians | 10.7 /100 | #216 | Poor 11.8% |
| Barbadians | 9.5 /100 | #217 | Tragic 11.8% |
| Immigrants | Bahamas | 9.2 /100 | #218 | Tragic 11.8% |
| Czechoslovakians | 9.0 /100 | #219 | Tragic 11.8% |
| Immigrants | West Indies | 8.9 /100 | #220 | Tragic 11.8% |